Динамическая стоп-лосс стратегия количественной оценки EMA double cross

2
Follow
480
Followers
Обзор
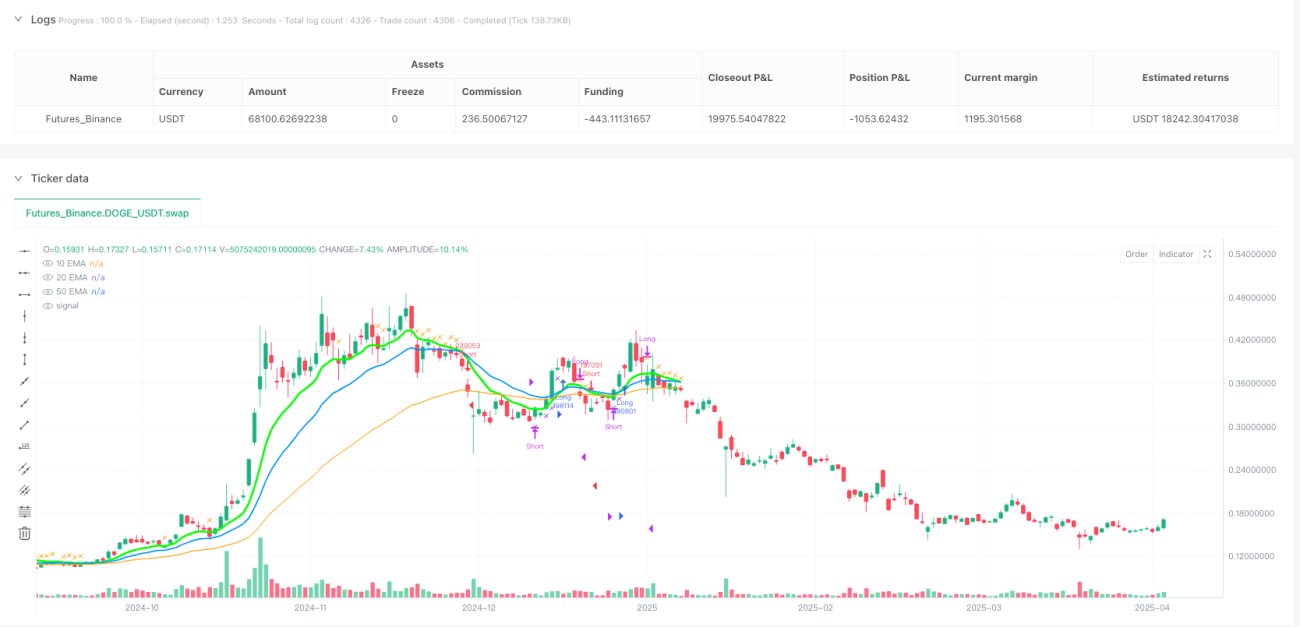
Стратегия основана на принципе двойного пересечения индексных скользящих средних (EMA) в сочетании с конструкцией динамического стоп-механизма. Стратегия использует 10-дневную ЭМА и 20-дневную ЭМА в качестве основного торгового сигнала, а также 50-дневную ЭМА в качестве трендового фильтра, используя 10-дневную ЭМА в качестве динамической стоп-линии.
Стратегический принцип
- Выбор в зависимости от пространства:
- Многополосное условие: подтверждение многополосной тенденции происходит, когда 10-дневная ЭМА пересекает 20-дневную ЭМА с нижней стороны и текущая цена закрытия превышает 50-дневную ЭМА
- Поверхностная ситуация: когда 10-дневная ЭМА сверху проходит 20-дневную ЭМА (см. мертвую вилку), и текущая цена закрытия ниже 50-дневной ЭМА, подтверждение поверхностной тенденции.
- Динамический механизм остановки убытков:
- В период многоочередного позиционирования, если конечная цена упадет ниже 10-дневной ЭМА, то будет задействован стоп-потеря.
- В период открытой позиции, если конечная цена превысит 10-дневную ЭМА, то будет задействован стоп-потеря.
- Фильтр трендов50-дневная EMA используется в качестве фильтра долгосрочных тенденций, чтобы избежать частого трейдинга в условиях шока.
Анализ преимуществ
- Способность отслеживать тенденцииДвойная EMA-перекрестка эффективно улавливает среднесрочные тенденции, 50-дневная EMA-фильтрация уменьшает ложные сигналы.
- Динамическое управление рисками10: Дневная EMA - динамическая стоп-линия, которая может быть скорректирована по тренду, чтобы защитить прибыль.
- Визуализация: Различает три EMA в разных цветах и ширинах, а также помечает сигналы купли-продажи, что позволяет осуществлять мониторинг в режиме реального времени.
- Настройка параметров: Цикл EMA может быть гибко скорректирован с помощью входных параметров для адаптации к различным рыночным колебаниям.
Анализ рисков
- Риск отставанияПо оценкам EMA, в случае быстрой реверсии может произойти значительное отступление, основанное на исторических данных.
- Решение проблемы: в сочетании с динамическими индикаторами (например, RSI) фильтрует крайние колебания.
- Убытки в результате кризисаПри отсутствии тренда, перекрестные сигналы могут часто вызывать недействительные сделки.
- Решение проблемыВведение волатильных показателей (например, ATR) приостанавливает торговлю.
- Параметры не совпадают.: фиксированный цикл EMA может не соответствовать всем состояниям рынка
- Решение проблемыПрименение адаптивных алгоритмов или многократных временных рамок для проверки.
Направление оптимизации
- Усиление комбинированного сигнала:
- Увеличение количества подтверждений (например, усиление при прорыве), повышение надежности сигнала.
- Динамическое управление позициями:
- Корректируйте размер позиции в зависимости от волатильности (ATR), чтобы снизить воздействие в период повышенного риска.
- Оптимизация машинного обучения:
- Динамическая оптимизация циклического портфеля EMA с использованием модели обучения историческим данным.
- Проверка многовременных рамок:
- Требование, чтобы направление EMA на уровне окружности совпадало с сигналом солнечной линии, повышает выигрышность.
Подвести итог
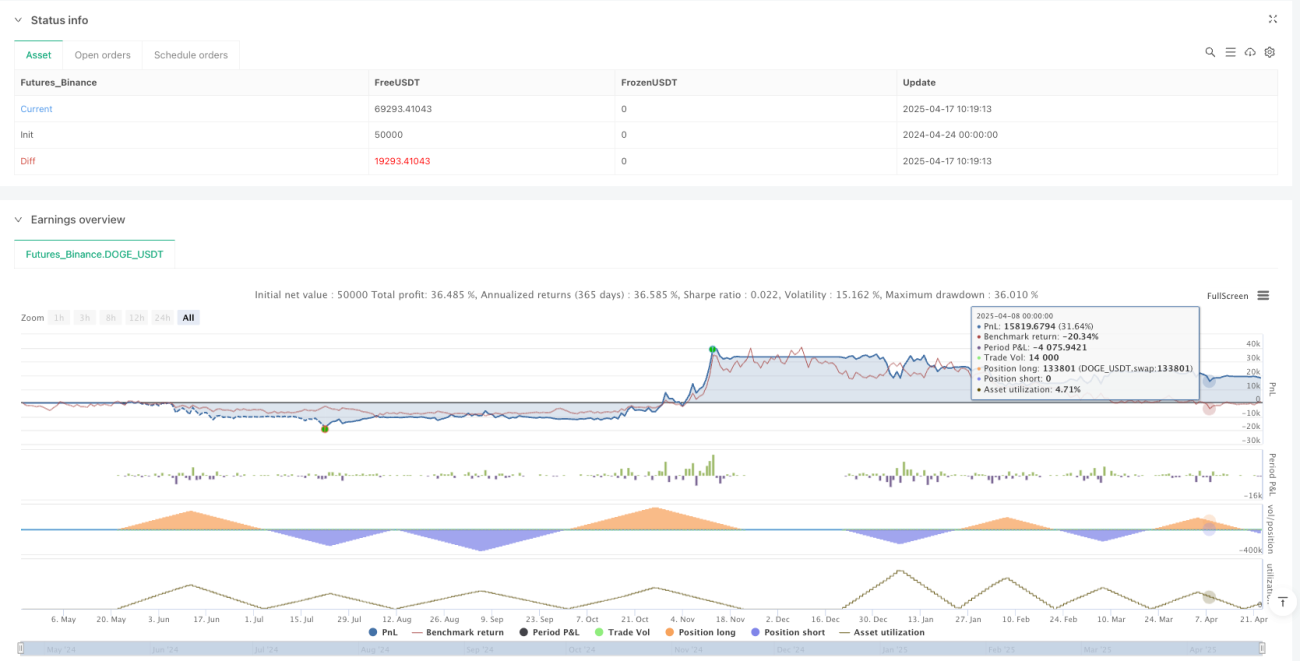
Эта стратегия достигает баланса между отслеживанием тенденций и управлением рисками путем сочетания двойного пересечения EMA и динамического остановки. Ее ключевые преимущества заключаются в четкой логической структуре и интуитивно понятной визуальной конструкции, подходящей для средне- и низкочастотных торговых сценариев.
Source
Pine
Strategy parameters
Related strategies
Comment
All comments (0)
No data
- 1