
Эта стратегия использует бинарную движущуюся среднюю ((EMA) для определения высокой вероятности возникновения реверсивных возможностей. Это не простая стратегия пересечения средней линии, а поиск времени, когда цена может отскочить от EMA и сформировать сильную динамику. Стратегия использует 12-циклические и 21-циклические EMA для построения торговых поясов и сочетает в себе графические формы, тенденционную согласованность и точную систему управления рисками для захвата рыночной динамики.
Ключевой принцип стратегии заключается в поиске входных сигналов, идентифицируя ситуации, когда цена отскочила от EMA. Она использует 12-циклические и 21-циклические EMA для создания верхних и нижних торговых полос и определяет направление рыночной тенденции в зависимости от относительной позиции EMA.
Когда EMA12 > EMA21, рынок находится в позитивной среде (зеленая полоса), мы ищем возможность сделать многое. Некоторые условия включают в себя: снижение цены доступа к полосе EMA, формирование сильного позитивного тренда (субъекты больше нижней линии), минимизация верхней линии (меньше 2% от диапазона поперечного тренда), закрытие цены выше двух EMA, предыдущий тренд не опустился ниже нижней полосы, а также несколько последовательных корней, которые сохраняют консистенцию поперечного тренда.
Когда EMA12 < EMA21, рынок находится в пониженной среде (красная полоса), мы ищем возможность для дефолта. Условия дефолта включают: верхняя линия цены касается полосы EMA, формируя сильный пониженный поток (сущности больше, чем верхняя линия), минимизация нижней линии (меньше, чем 2% от диапазона паутины), закрытие цены ниже двух EMA, предыдущая паутина не закрывается над верхней полосой, а также несколько последовательных корней, сохраняющих консистенцию нисходящей тенденции.
Встроенная система управления рисками с фиксированным соотношением риска и прибыли, по умолчанию 3: 1, остановка убытков устанавливается на предыдущей высокой / низкой точке, остановка автоматически рассчитывается в соответствии с соотношением риска и прибыли.
Эта стратегия имеет несколько значительных преимуществ:
Потенциал высокой выигрышной вероятности: стратегия позволяет идентифицировать торговые возможности с высокой вероятностью успеха, используя сильную динамику после отскока по полосе EMA.
Четкие правила входа и выхода: стратегия обеспечивает четкие условия торговли, уменьшая влияние субъективного суждения и эмоциональных решений.
Отличный риск-менеджмент: с фиксированным риском-рентабельностью и автоматической установкой стоп-стоп, чтобы гарантировать, что риск каждой сделки контролируется.
Тенденция следует преимуществу: стратегия заключается в том, чтобы торговать только в направлении, которое преобладает над трендом, избегая высокого риска обратной операции.
Использование в различных временных периодах: Стратегия может эффективно работать в различных временных периодах, обеспечивая гибкий выбор торгов.
Комплексная система напоминаний: встроенная функция напоминания о подробных торговых сигналах, гарантирующая, что вы не пропустите торговые возможности.
Визуальная помощь: интуитивное отображение торговых сигналов и состояния условий с помощью изменения цвета фона и указателей ярлыков.
Несмотря на хорошую конструкцию, существуют следующие потенциальные риски:
Риск шокирующего рынка: в поперечном или шокирующем рынке полоса EMA может стать плотной, создавая частые, но низкокачественные сигналы, что приводит к последовательным остановкам.
Риск резкого падения: рынок может подняться после важных новостей или событий, что может привести к неэффективности остановок и убыткам, превышающим ожидания.
Чрезмерная оптимизация параметров: чрезмерная оптимизация параметров стратегии может привести к корректировке кривой, что приводит к плохой эффективности стратегии в реальной торговле.
Задержка в распознавании трендов: EMA, как отсталый показатель, может медленно реагировать на переломные моменты в тренде, что приводит к пропуску оптимальной точки входа или задержке выхода.
Риск возникновения сбоев: рыночный шум может привести к тому, что после возникновения сбоев цена вернется в ожидаемое направление, что приведет к ненужным потерям.
Решения включают в себя: приостановку торговли на рынке во время колебаний; использование фильтров волатильности, чтобы избежать низкокачественных сигналов; подтверждение тенденций в сочетании с другими показателями; регулярная отсчет и оптимизация параметров; рассмотрение использования стоп-лосса для отслеживания.
Эта стратегия может быть оптимизирована в следующих направлениях:
Динамическое управление рисками: автоматическая корректировка коэффициента возврата риска и размеров позиций в зависимости от волатильности рынка, снижение рисковых выходов в условиях высокой волатильности.
Высокоуровневые фильтры вводятся: в сочетании с показателем ATR (средняя реальная длина волны) для фильтрации сигналов в период низких колебаний; добавление подтверждения объема сделки для проверки эффективности ценового отскока.
Многовременный анализ: интеграция тенденций более высоких временных циклов в качестве дополнительного фильтра, вводится только в том случае, если тенденции совпадают в нескольких временных периодах.
Оптимизация машинного обучения: динамическая настройка параметров с использованием алгоритмов машинного обучения, адаптирующая оптимальную комбинацию параметров в зависимости от различных рыночных условий.
Следить за достижением стоп-лосса: после достижения определенного уровня прибыли, внедряется механизм слежения за стоп-лоссами, блокирующий часть прибыли и позволяющий тенденции развиваться.
Частичная стратегия прибыли: реализация стратегии получения прибыли по частям, постепенное снижение позиций при различных целевых ценах, оптимизация общей отдачи от риска.
Эти направления оптимизации могут повысить устойчивость, адаптивность и долгосрочную рентабельность стратегий.
Двухиндексальная стратегия торговли с отскоком в полосе средних движущихся линий - это комплексная система торговли, которая сочетает в себе технический анализ, идентификацию графических паттернов и строгое управление рисками. Она захватывает рыночные возможности с взрывоопасной динамикой, идентифицируя высоковероятные точки отскока цены от полосы EMA.
Несмотря на наличие некоторых потенциальных рисков, трейдеры могут еще больше повысить устойчивость и прибыльность стратегии путем применения рекомендуемых оптимизационных мер. Эта стратегия особенно подходит для трейдеров, которые ищут систематизированный, дисциплинированный и контролируемый риском способ торговли, и может принести пользу как краткосрочным, так и среднесрочным и долгосрочным инвесторам.
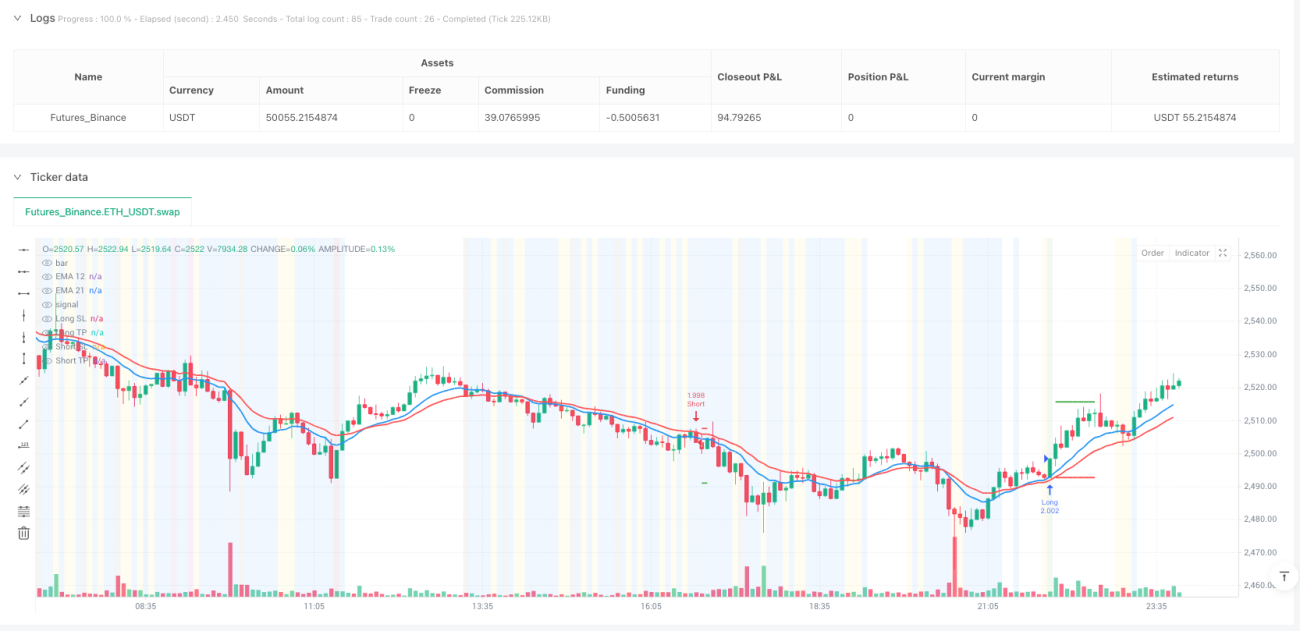
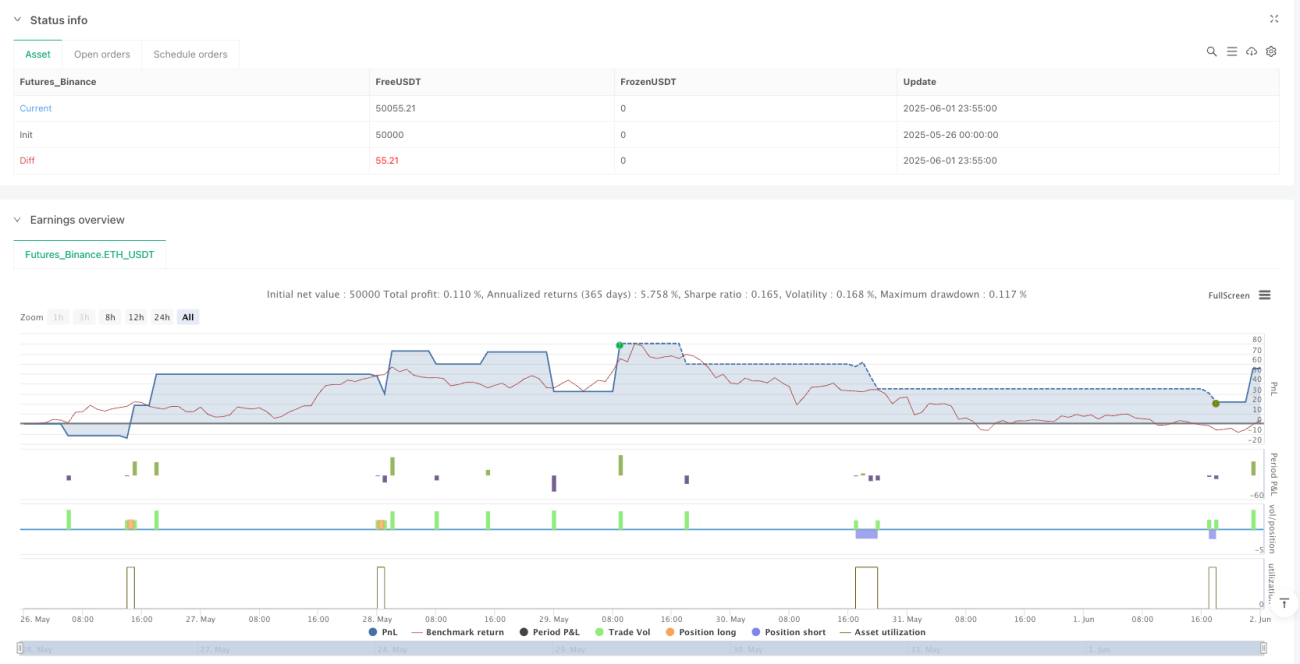
/*backtest
start: 2025-05-26 00:00:00
end: 2025-06-02 00:00:00
period: 5m
basePeriod: 5m
exchanges: [{"eid":"Futures_Binance","currency":"ETH_USDT"}]
*/
//@version=5
strategy("Enhanced EMA Band Rejection Strategy", overlay=true, initial_capital=10000, default_qty_type=strategy.percent_of_equity, default_qty_value=10)
// Input parameters
ema12_length = input.int(12, title="EMA 12 Length")
ema21_length = input.int(21, title="EMA 21 Length")
max_wick_percent = input.float(2.0, title="Max Wick % at High/Low", minval=0.0, maxval=10.0)
risk_reward_ratio = input.float(3.0, title="Risk/Reward Ratio (R)", minval=1.0, maxval=10.0)
trend_consistency_bars = input.int(5, title="Trend Consistency Required (Bars)", minval=1, maxval=20)
// Notification Settings
enable_notifications = input.bool(true, title="Enable Notifications", group="Notifications")
notify_on_entry = input.bool(true, title="Notify on Trade Entry", group="Notifications")
notify_on_exit = input.bool(true, title="Notify on Trade Exit", group="Notifications")
notify_on_setup = input.bool(false, title="Notify on Potential Setup (Pre-Entry)", group="Notifications")
notify_on_failed_conditions = input.bool(false, title="Notify on Failed Conditions", group="Notifications")
// Calculate EMAs
ema12 = ta.ema(close, ema12_length)
ema21 = ta.ema(close, ema21_length)
// Determine upper and lower EMA bands
ema_upper = math.max(ema12, ema21)
ema_lower = math.min(ema12, ema21)
// Plot EMAs
plot(ema12, color=color.blue, linewidth=2, title="EMA 12")
plot(ema21, color=color.red, linewidth=2, title="EMA 21")
// Calculate candle components
body_size = math.abs(close - open)
upper_wick = high - math.max(open, close)
lower_wick = math.min(open, close) - low
candle_range = high - low
// Calculate wick percentages
upper_wick_percent = candle_range > 0 ? (upper_wick / candle_range) * 100 : 0
lower_wick_percent = candle_range > 0 ? (lower_wick / candle_range) * 100 : 0
// Determine EMA trend direction
ema_bullish = ema12 > ema21 // Green bands - bullish trend
ema_bearish = ema12 < ema21 // Red bands - bearish trend
// Check trend consistency for required number of bars
bullish_consistency_check = true
bearish_consistency_check = true
for i = 0 to trend_consistency_bars - 1
ema12_past = ta.ema(close[i], ema12_length)
ema21_past = ta.ema(close[i], ema21_length)
if ema12_past <= ema21_past
bullish_consistency_check := false
if ema12_past >= ema21_past
bearish_consistency_check := false
// Final trend conditions with consistency requirement
ema_bullish_consistent = ema_bullish and bullish_consistency_check
ema_bearish_consistent = ema_bearish and bearish_consistency_check
// NEW RULE: Previous candle close position relative to bands
prev_close_above_upper_band = close[1] > ema_upper[1]
prev_close_below_lower_band = close[1] < ema_lower[1]
prev_close_within_bands = close[1] >= ema_lower[1] and close[1] <= ema_upper[1]
// Long setup conditions (only when EMAs are bullish/green consistently)
long_wick_condition = low <= ema_lower or (low <= ema_upper and low >= ema_lower)
long_body_condition = body_size >= lower_wick
long_wick_percent_condition = upper_wick_percent <= max_wick_percent
long_bullish_candle = close > open
long_trend_condition = ema_bullish_consistent // Only long when bands are consistently green
long_close_above_bands = close > ema_upper // NEW: Close must be above both EMAs
// Previous candle must not have closed below the lower band
long_prev_close_condition = not prev_close_below_lower_band
long_setup = long_wick_condition and long_body_condition and long_wick_percent_condition and long_bullish_candle and long_trend_condition and long_close_above_bands and long_prev_close_condition
// Short setup conditions (only when EMAs are bearish/red consistently)
short_wick_condition = high >= ema_upper or (high >= ema_lower and high <= ema_upper)
short_body_condition = body_size >= upper_wick
short_wick_percent_condition = lower_wick_percent <= max_wick_percent
short_bearish_candle = close < open
short_trend_condition = ema_bearish_consistent // Only short when bands are consistently red
short_close_below_bands = close < ema_lower // NEW: Close must be below both EMAs
// Previous candle must not have closed above the upper band
short_prev_close_condition = not prev_close_above_upper_band
short_setup = short_wick_condition and short_body_condition and short_wick_percent_condition and short_bearish_candle and short_trend_condition and short_close_below_bands and short_prev_close_condition
// Entry conditions
var float long_sl = na
var float short_sl = na
var float long_tp = na
var float short_tp = na
if long_setup and strategy.position_size == 0
strategy.entry("Long", strategy.long)
long_sl := low
risk_amount = close - long_sl
long_tp := close + (risk_amount * risk_reward_ratio)
label.new(bar_index, low, "LONG", style=label.style_label_up, color=color.green, size=size.small)
// Entry Notification
if enable_notifications and notify_on_entry
alert("🟢 LONG ENTRY SIGNAL\n" +
"Symbol: " + syminfo.ticker + "\n" +
"Price: " + str.tostring(close, "#.####") + "\n" +
"Stop Loss: " + str.tostring(long_sl, "#.####") + "\n" +
"Take Profit: " + str.tostring(long_tp, "#.####") + "\n" +
"Risk/Reward: " + str.tostring(risk_reward_ratio, "#.##") + "R\n" +
"Time: " + str.tostring(time), alert.freq_once_per_bar)
if short_setup and strategy.position_size == 0
strategy.entry("Short", strategy.short)
short_sl := high
risk_amount = short_sl - close
short_tp := close - (risk_amount * risk_reward_ratio)
label.new(bar_index, high, "SHORT", style=label.style_label_down, color=color.red, size=size.small)
// Entry Notification
if enable_notifications and notify_on_entry
alert("🔴 SHORT ENTRY SIGNAL\n" +
"Symbol: " + syminfo.ticker + "\n" +
"Price: " + str.tostring(close, "#.####") + "\n" +
"Stop Loss: " + str.tostring(short_sl, "#.####") + "\n" +
"Take Profit: " + str.tostring(short_tp, "#.####") + "\n" +
"Risk/Reward: " + str.tostring(risk_reward_ratio, "#.##") + "R\n" +
"Time: " + str.tostring(time), alert.freq_once_per_bar)
// Exit conditions with fixed R:R
if strategy.position_size > 0
// Long position - fixed stop loss and take profit
strategy.exit("Long Exit", "Long", stop=long_sl, limit=long_tp)
// Exit Notifications
if enable_notifications and notify_on_exit
if close <= long_sl
alert("🛑 LONG STOP LOSS HIT\n" +
"Symbol: " + syminfo.ticker + "\n" +
"Exit Price: " + str.tostring(close, "#.####") + "\n" +
"Loss: " + str.tostring(close - strategy.position_avg_price, "#.####") + "\n" +
"Time: " + str.tostring(time), alert.freq_once_per_bar)
if close >= long_tp
alert("🎯 LONG TAKE PROFIT HIT\n" +
"Symbol: " + syminfo.ticker + "\n" +
"Exit Price: " + str.tostring(close, "#.####") + "\n" +
"Profit: " + str.tostring(close - strategy.position_avg_price, "#.####") + "\n" +
"Time: " + str.tostring(time), alert.freq_once_per_bar)
if strategy.position_size < 0
// Short position - fixed stop loss and take profit
strategy.exit("Short Exit", "Short", stop=short_sl, limit=short_tp)
// Exit Notifications
if enable_notifications and notify_on_exit
if close >= short_sl
alert("🛑 SHORT STOP LOSS HIT\n" +
"Symbol: " + syminfo.ticker + "\n" +
"Exit Price: " + str.tostring(close, "#.####") + "\n" +
"Loss: " + str.tostring(strategy.position_avg_price - close, "#.####") + "\n" +
"Time: " + str.tostring(time), alert.freq_once_per_bar)
if close <= short_tp
alert("🎯 SHORT TAKE PROFIT HIT\n" +
"Symbol: " + syminfo.ticker + "\n" +
"Exit Price: " + str.tostring(close, "#.####") + "\n" +
"Profit: " + str.tostring(strategy.position_avg_price - close, "#.####") + "\n" +
"Time: " + str.tostring(time), alert.freq_once_per_bar)
// Plot stop levels and take profit levels
plot(strategy.position_size > 0 ? long_sl : na, color=color.red, linewidth=2, style=plot.style_line, title="Long SL")
plot(strategy.position_size < 0 ? short_sl : na, color=color.red, linewidth=2, style=plot.style_line, title="Short SL")
plot(strategy.position_size > 0 ? long_tp : na, color=color.green, linewidth=2, style=plot.style_line, title="Long TP")
plot(strategy.position_size < 0 ? short_tp : na, color=color.green, linewidth=2, style=plot.style_line, title="Short TP")
// Additional Notification Logic
// Potential Setup Notifications (when most conditions are met but not all)
long_potential_setup = long_wick_condition and long_body_condition and long_wick_percent_condition and long_bullish_candle and long_trend_condition and long_prev_close_condition and not long_close_above_bands
short_potential_setup = short_wick_condition and short_body_condition and short_wick_percent_condition and short_bearish_candle and short_trend_condition and short_prev_close_condition and not short_close_below_bands
if enable_notifications and notify_on_setup and strategy.position_size == 0
if long_potential_setup
alert("⚠️ POTENTIAL LONG SETUP\n" +
"Symbol: " + syminfo.ticker + "\n" +
"Price: " + str.tostring(close, "#.####") + "\n" +
"Status: Close needs to be above " + str.tostring(ema_upper, "#.####") + "\n" +
"Current Close: " + str.tostring(close, "#.####") + "\n" +
"Time: " + str.tostring(time), alert.freq_once_per_bar)
if short_potential_setup
alert("⚠️ POTENTIAL SHORT SETUP\n" +
"Symbol: " + syminfo.ticker + "\n" +
"Price: " + str.tostring(close, "#.####") + "\n" +
"Status: Close needs to be below " + str.tostring(ema_lower, "#.####") + "\n" +
"Current Close: " + str.tostring(close, "#.####") + "\n" +
"Time: " + str.tostring(time), alert.freq_once_per_bar)
// Failed Conditions Notifications (for debugging)
if enable_notifications and notify_on_failed_conditions and strategy.position_size == 0
if long_wick_condition and long_body_condition and long_wick_percent_condition and long_bullish_candle and not long_trend_condition
alert("❌ LONG SETUP FAILED\n" +
"Symbol: " + syminfo.ticker + "\n" +
"Reason: " + (not ema_bullish ? "EMA trend bearish" : "EMA trend not consistent") + "\n" +
"EMA12: " + str.tostring(ema12, "#.####") + "\n" +
"EMA21: " + str.tostring(ema21, "#.####") + "\n" +
"Time: " + str.tostring(time), alert.freq_once_per_bar)
if short_wick_condition and short_body_condition and short_wick_percent_condition and short_bearish_candle and not short_trend_condition
alert("❌ SHORT SETUP FAILED\n" +
"Symbol: " + syminfo.ticker + "\n" +
"Reason: " + (not ema_bearish ? "EMA trend bullish" : "EMA trend not consistent") + "\n" +
"EMA12: " + str.tostring(ema12, "#.####") + "\n" +
"EMA21: " + str.tostring(ema21, "#.####") + "\n" +
"Time: " + str.tostring(time), alert.freq_once_per_bar)
bgcolor(long_setup ? color.new(color.green, 90) : na, title="Long Setup")
bgcolor(short_setup ? color.new(color.red, 90) : na, title="Short Setup")
// Show when previous close condition fails
bgcolor(long_wick_condition and long_body_condition and long_wick_percent_condition and long_bullish_candle and long_trend_condition and prev_close_below_lower_band ? color.new(color.orange, 95) : na, title="Long Rejected by Prev Close")
bgcolor(short_wick_condition and short_body_condition and short_wick_percent_condition and short_bearish_candle and short_trend_condition and prev_close_above_upper_band ? color.new(color.orange, 95) : na, title="Short Rejected by Prev Close")
// Detailed debugging for failed conditions
long_all_conditions_except_prev = long_wick_condition and long_body_condition and long_wick_percent_condition and long_bullish_candle and long_trend_condition and long_close_above_bands
bgcolor(long_all_conditions_except_prev and prev_close_below_lower_band ? color.new(color.purple, 90) : na, title="Long Failed: Prev Close Below Band")
bgcolor(long_wick_condition and not long_body_condition ? color.new(color.yellow, 90) : na, title="Long Failed: Body Too Small")
bgcolor(long_wick_condition and long_body_condition and not long_wick_percent_condition ? color.new(color.blue, 90) : na, title="Long Failed: Upper Wick Too Big")
bgcolor(long_wick_condition and long_body_condition and long_wick_percent_condition and not long_bullish_candle ? color.new(color.gray, 90) : na, title="Long Failed: Not Bullish Candle")
bgcolor(long_wick_condition and long_body_condition and long_wick_percent_condition and long_bullish_candle and ema_bullish and not ema_bullish_consistent ? color.new(color.fuchsia, 90) : na, title="Long Failed: Trend Not Consistent")
bgcolor(long_wick_condition and long_body_condition and long_wick_percent_condition and long_bullish_candle and not ema_bullish ? color.new(color.maroon, 90) : na, title="Long Failed: EMA Trend Bearish")
bgcolor(long_wick_condition and long_body_condition and long_wick_percent_condition and long_bullish_candle and long_trend_condition and not long_close_above_bands ? color.new(color.lime, 90) : na, title="Long Failed: Close Not Above Bands")
// Similar debugging for shorts
short_all_conditions_except_prev = short_wick_condition and short_body_condition and short_wick_percent_condition and short_bearish_candle and short_trend_condition and short_close_below_bands
bgcolor(short_all_conditions_except_prev and prev_close_above_upper_band ? color.new(color.purple, 90) : na, title="Short Failed: Prev Close Above Band")
bgcolor(short_wick_condition and short_body_condition and short_wick_percent_condition and short_bearish_candle and short_trend_condition and not short_close_below_bands ? color.new(color.aqua, 90) : na, title="Short Failed: Close Not Below Bands")
// Enhanced table for debugging
if barstate.islast
var table debug_table = table.new(position.top_right, 2, 19, bgcolor=color.white, border_width=1)
table.cell(debug_table, 0, 0, "Condition", text_color=color.black, bgcolor=color.gray)
table.cell(debug_table, 1, 0, "Value", text_color=color.black, bgcolor=color.gray)
table.cell(debug_table, 0, 1, "Body Size", text_color=color.black)
table.cell(debug_table, 1, 1, str.tostring(body_size, "#.##"), text_color=color.black)
table.cell(debug_table, 0, 2, "Upper Wick", text_color=color.black)
table.cell(debug_table, 1, 2, str.tostring(upper_wick, "#.##"), text_color=color.black)
table.cell(debug_table, 0, 3, "Lower Wick", text_color=color.black)
table.cell(debug_table, 1, 3, str.tostring(lower_wick, "#.##"), text_color=color.black)
table.cell(debug_table, 0, 4, "Upper Wick %", text_color=color.black)
table.cell(debug_table, 1, 4, str.tostring(upper_wick_percent, "#.##") + "%", text_color=color.black)
table.cell(debug_table, 0, 5, "Lower Wick %", text_color=color.black)
table.cell(debug_table, 1, 5, str.tostring(lower_wick_percent, "#.##") + "%", text_color=color.black)
table.cell(debug_table, 0, 6, "EMA Upper", text_color=color.black)
table.cell(debug_table, 1, 6, str.tostring(ema_upper, "#.##"), text_color=color.black)
table.cell(debug_table, 0, 7, "EMA Lower", text_color=color.black)
table.cell(debug_table, 1, 7, str.tostring(ema_lower, "#.##"), text_color=color.black)
table.cell(debug_table, 0, 8, "R:R Ratio", text_color=color.black)
table.cell(debug_table, 1, 8, str.tostring(risk_reward_ratio, "#.##") + "R", text_color=color.black)
table.cell(debug_table, 0, 9, "Position", text_color=color.black)
table.cell(debug_table, 1, 9, strategy.position_size > 0 ? "LONG" : strategy.position_size < 0 ? "SHORT" : "NONE", text_color=color.black)
// NEW DEBUG INFO
table.cell(debug_table, 0, 10, "Prev Close", text_color=color.black)
table.cell(debug_table, 1, 10, str.tostring(close[1], "#.##"), text_color=color.black)
table.cell(debug_table, 0, 11, "Prev Above Upper", text_color=color.black)
table.cell(debug_table, 1, 11, prev_close_above_upper_band ? "YES" : "NO", text_color=color.black)
table.cell(debug_table, 0, 12, "Prev Below Lower", text_color=color.black)
table.cell(debug_table, 1, 12, prev_close_below_lower_band ? "YES" : "NO", text_color=color.black)
table.cell(debug_table, 0, 13, "Prev Within Bands", text_color=color.black)
table.cell(debug_table, 1, 13, prev_close_within_bands ? "YES" : "NO", text_color=color.black)
// NEW: Trend consistency info
table.cell(debug_table, 0, 14, "Bullish Consistent", text_color=color.black)
table.cell(debug_table, 1, 14, ema_bullish_consistent ? "YES" : "NO", text_color=color.black)
table.cell(debug_table, 0, 15, "Bearish Consistent", text_color=color.black)
table.cell(debug_table, 1, 15, ema_bearish_consistent ? "YES" : "NO", text_color=color.black)
table.cell(debug_table, 0, 16, "Consistency Bars", text_color=color.black)
table.cell(debug_table, 1, 16, str.tostring(trend_consistency_bars), text_color=color.black)
// NEW: Close position relative to bands
table.cell(debug_table, 0, 17, "Close Above Upper", text_color=color.black)
table.cell(debug_table, 1, 17, close > ema_upper ? "YES" : "NO", text_color=color.black)
table.cell(debug_table, 0, 18, "Close Below Lower", text_color=color.black)
table.cell(debug_table, 1, 18, close < ema_lower ? "YES" : "NO", text_color=color.black)