
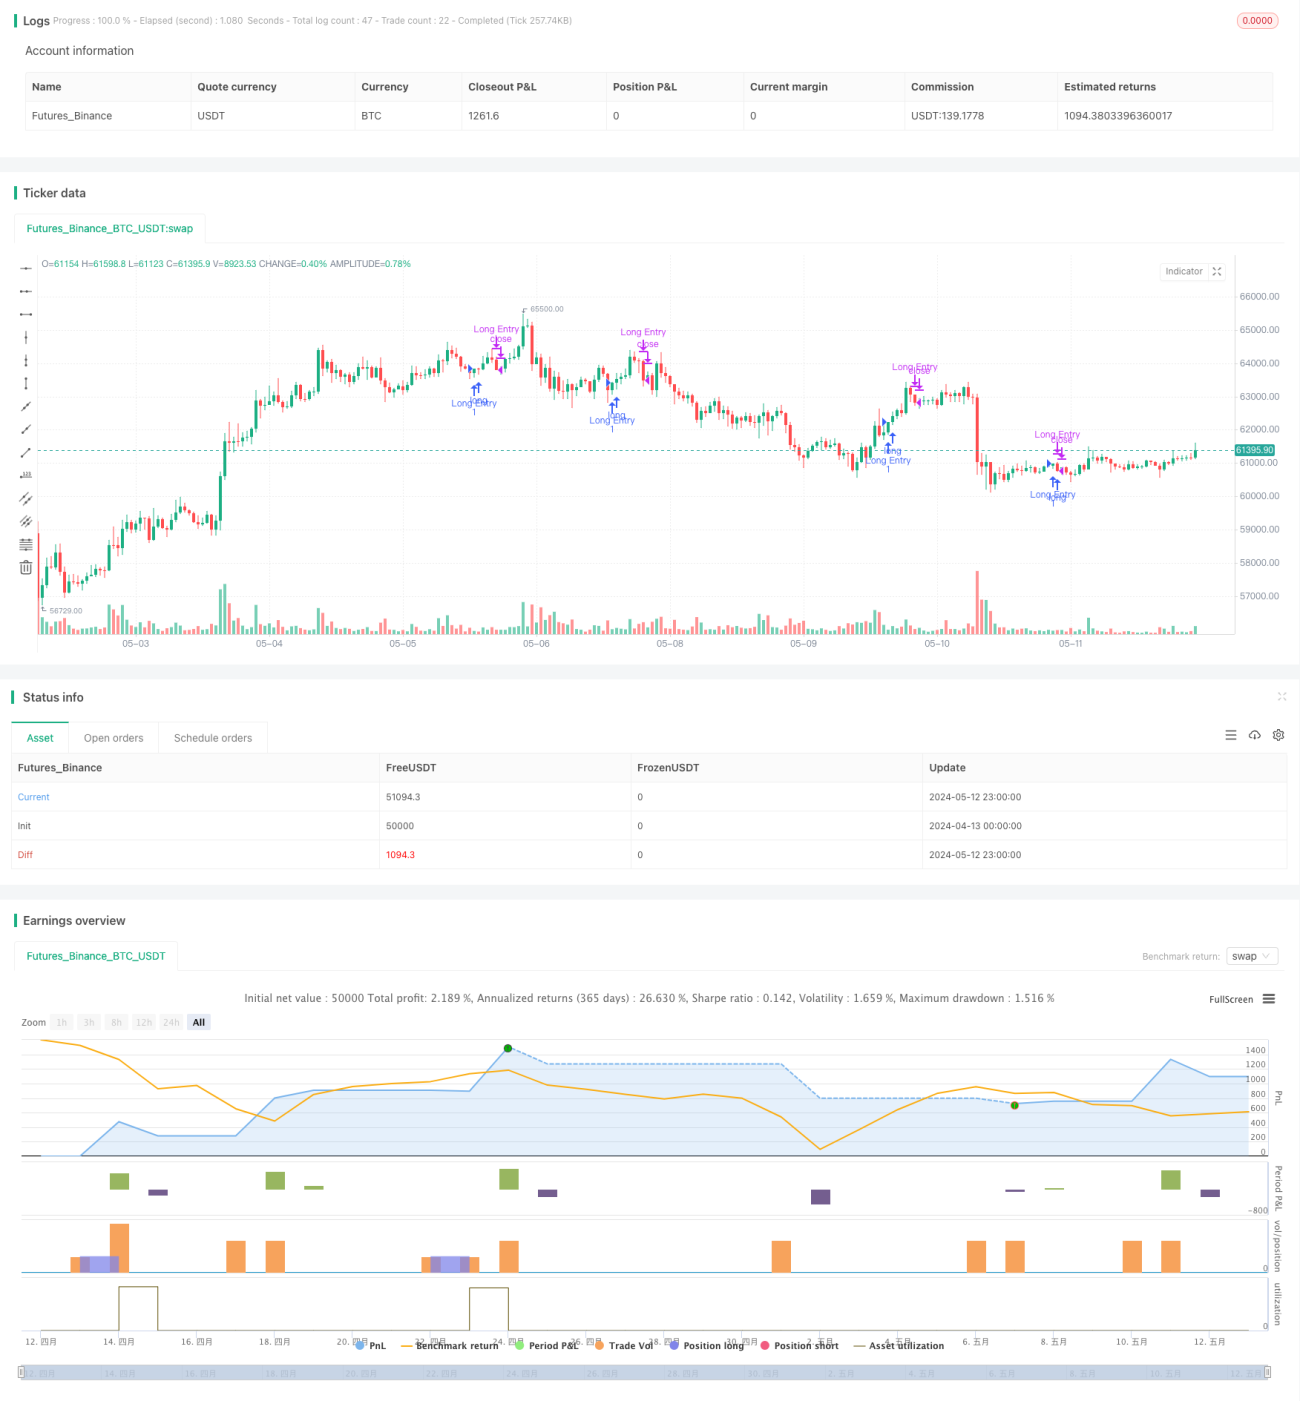
خلاصہ
اس حکمت عملی کا بنیادی خیال بالائی سائے کے بغیر صعودی موم بتیوں کو خریداری کے اشارے کے طور پر تلاش کرنا ہے، اور جب قیمت پچھلی موم بتی کی کم ترین سطح سے نیچے آجائے تو پوزیشن بند کرنا ہے۔ یہ حکمت عملی صعودی موم بتیوں کی اس خصوصیت کو استعمال کرتی ہے کہ ان کا بالائی سایہ بہت چھوٹا ہوتا ہے، جو مضبوط صعودی قوت کی نشاندہی کرتا ہے اور قیمتوں میں مزید اضافے کے امکانات کو بڑھاتا ہے۔ ساتھ ہی، پچھلی موم بتی کی کم ترین سطح کو اسٹاپ لاس کے طور پر استعمال کرکے خطرے کو مؤثر طریقے سے کنٹرول کیا جاسکتا ہے۔
حکمت عملی کے اصول
- اس بات کا تعین کریں کہ آیا موجودہ موم بتی صعودی ہے (بند قیمت افتتاحی قیمت سے زیادہ)۔
- موجودہ موم بتی کے بالائی سائے کی لمبائی اور اس کے جسم کی لمبائی کا تناسب شمار کریں۔
- اگر بالائی سائے کا تناسب 5% سے کم ہو تو اسے بغیر بالائی سائے کے ایک درست صعودی موم بتی سمجھیں اور خریداری کا اشارہ دیں۔
- خریداری کے بعد پچھلی موم بتی کی کم ترین قیمت کو اسٹاپ لاس کی سطح کے طور پر ریکارڈ کریں۔
- جب قیمت اسٹاپ لاس کی سطح سے نیچے آجائے تو پوزیشن بند کرکے باہر نکلیں۔
حکمت عملی کے فوائد
- بغیر بالائی سائے کے صعودی موم بتیوں کے ذریعے داخل ہونے سے رجحان کی طاقت زیادہ ہوتی ہے اور کامیابی کا امکان بڑھ جاتا ہے۔
- پچھلی موم بتی کی کم ترین سطح کو اسٹاپ لاس کے طور پر استعمال کرنے سے خطرہ قابل کنٹرول رہتا ہے۔
- منطق سادہ ہے، نافذ کرنا اور بہتر بنانا آسان ہے۔
- رجحانی مارکیٹوں میں استعمال کے لیے موزوں ہے۔
حکمت عملی کے خطرات
- ممکن ہے کہ خریداری کے اشارے کے فوراً بعد قیمت واپس آکر اسٹاپ لاس کو متحرک کردے۔
- زیادہ اتار چڑھاؤ والی مصنوعات کے لیے اسٹاپ لاس کی سطح خریداری کی قیمت کے بہت قریب ہوسکتی ہے، جس کی وجہ سے قبل از وقت اسٹاپ آؤٹ ہوسکتا ہے۔
- منافع کے ہدف کی کمی کی وجہ سے بہترین اخراج کے وقت کا تعین کرنا مشکل ہوجاتا ہے۔
حکمت عملی کی بہتری کی سمتیں
- دیگر اشارے جیسے MA، MACD وغیرہ کے ساتھ ملا کر رجحان کی طاقت کی تصدیق کریں، جس سے داخلے کے اشاروں کی تاثیر بہتر ہوگی۔
- زیادہ اتار چڑھاؤ والی مصنوعات کے لیے اسٹاپ لاس کی سطح کو مزید دور رکھیں، جیسے پچھلی N موم بتیوں کی کم ترین قیمت، تاکہ اسٹاپ لاس کی تعدد کم ہو۔
- منافع کے ہدف متعارف کروائیں، جیسے N گنا ATR یا فیصدی منافع، تاکہ بروقت منافع محفوظ کیا جاسکے۔
- پوزیشن مینجمنٹ شامل کرنے پر غور کریں، جیسے اشارے کی طاقت کے مطابق پوزیشن کا سائز ایڈجسٹ کرنا۔
خلاصہ
یہ حکمت عملی رجحانی مارکیٹوں میں منافع حاصل کرنے کے لیے بغیر بالائی سائے کے صعودی موم بتیوں کے ذریعے داخل ہوتی ہے اور پچھلی موم بتی کی کم ترین سطح کو اسٹاپ لاس کے طور پر استعمال کرتی ہے۔ تاہم، اس حکمت عملی میں کچھ حدود بھی ہیں، جیسے اسٹاپ لاس کی جگہ کا لچکدار نہ ہونا اور منافع کے ہدف کی کمی۔ دیگر اشارے متعارف کروا کر سگنلز کو فلٹر کرنے، اسٹاپ لاس کی پوزیشن کو بہتر بنانے، اور منافع کے اہداف مقرر کرنے جیسی بہتریوں کے ذریعے حکمت عملی کو مزید مضبوط اور مؤثر بنایا جاسکتا ہے۔
Overview
The main idea of this strategy is to find bullish candles without upper wicks as buy signals and close positions when the price breaks below the low of the previous candle. The strategy utilizes the characteristic of bullish candles with very small upper wicks, indicating strong bullish momentum and a higher probability of continued price increases. At the same time, using the low of the previous candle as a stop-loss level can effectively control risk.
Strategy Principles
- Determine if the current candle is a bullish candle (close price higher than open price)
- Calculate the ratio of the current candle's upper wick length to its body length
- If the upper wick ratio is less than 5%, consider it a valid bullish candle without an upper wick and generate a buy signal
- Record the lowest price of the previous candle after buying as the stop-loss level
- When the price breaks below the stop-loss level, close the position and exit
Strategy Advantages
- Selecting bullish candles without upper wicks for entry, the trend strength is greater and the success rate is higher
- Using the low of the previous candle as the stop-loss level, risks are controllable
- Simple logic, easy to implement and optimize
- Suitable for use in trending markets
Strategy Risks
- There may be cases where a buy signal is followed by an immediate pullback triggering the stop-loss
- For highly volatile instruments, the stop-loss level may be set too close to the buy price, leading to premature stop-outs
- Lack of profit targets, making it difficult to grasp the optimal exit timing
Strategy Optimization Directions
- Combine with other indicators such as MA, MACD, etc., to confirm trend strength and improve the effectiveness of entry signals
- For highly volatile instruments, set the stop-loss level at a further position, such as the lowest point of the previous N candles, to reduce the stop-loss frequency
- Introduce profit targets, such as N times ATR or percentage gains, to lock in profits in a timely manner
- Consider adding position management, such as adjusting position size based on signal strength
Summary
This strategy captures profits effectively in trending markets by selecting bullish candles without upper wicks for entry and using the low of the previous candle for stop-loss. However, the strategy also has certain limitations, such as inflexible stop-loss placement and lack of profit targets. Improvements can be made by introducing other indicators to filter signals, optimizing stop-loss positions, and setting profit targets to make the strategy more robust and effective.
- 1