سپر ٹرینڈ اور EMA امتزاج کی حکمت عملی

جائزہ
سپر ٹرینڈ اور ای ایم اے کا مجموعہ حکمت عملی ایک تجارتی حکمت عملی ہے جس میں سپر ٹرینڈ اشارے اور متعدد ای ایم اے اشارے کا استعمال کیا جاتا ہے۔ یہ حکمت عملی موجودہ مارکیٹ کی رجحان کی سمت کا فیصلہ کرنے کے لئے سپر ٹرینڈ اشارے کا استعمال کرتی ہے ، جبکہ مختلف دورانیے کے ای ایم اے اشارے کو خرید و فروخت کے سگنل کے طور پر استعمال کرتی ہے۔ جب قلیل مدتی ای ایم اے اور درمیانی مدت ای ایم اے میں فورک ہوتا ہے اور سپر ٹرینڈ اشارے اوپر کی طرف رجحان دکھاتا ہے تو ، خریدنے کا اشارہ ہوتا ہے۔ جب قلیل مدتی ای ایم اے اور درمیانی مدت ای ایم اے میں مورچا ہوتا ہے اور سپر ٹرینڈ اشارے نیچے کی طرف رجحان دکھاتا ہے تو ، فروخت کا اشارہ ہوتا ہے۔
حکمت عملی کا اصول
سپر ٹرینڈ اور ای ایم اے کی مجموعی حکمت عملی کا بنیادی اصول یہ ہے کہ سپر ٹرینڈ اشارے اور ای ایم اے اشارے کی خصوصیات کا استعمال کرکے مارکیٹ میں رجحان کی تبدیلیوں اور قیمت کے اتار چڑھاؤ کو پکڑیں۔ سپر ٹرینڈ اشارے موجودہ مارکیٹ کی سمت کا فیصلہ کرتے ہوئے موجودہ مارکیٹ کی سمت کا فیصلہ کرتے ہیں۔ جب بند ہونے والی قیمت پچھلے دور کے اوپر اور نیچے کی سمت سے ٹکرا جاتی ہے تو ، اس سے ظاہر ہوتا ہے کہ مارکیٹ اوپر کی طرف بڑھ رہی ہے۔ جب بند ہونے والی قیمت نیچے کی طرف گرتی ہے تو ، اس سے ظاہر ہوتا ہے کہ مارکیٹ نیچے کی طرف بڑھ رہی ہے۔
اسٹریٹجک فوائد
- رجحانات کی پیروی کرنے کی صلاحیت: سپر ٹرینڈ اشارے مارکیٹ میں رجحاناتی تبدیلیوں کو مؤثر طریقے سے پکڑ سکتے ہیں ، اور حکمت عملی کو مارکیٹ کے رجحانات کے مطابق تجارت کرنے میں مدد کرسکتے ہیں۔
- ایک سے زیادہ ای ایم اے کی تصدیق: خرید و فروخت کے اشارے کے لئے مختلف دورانیے کے ای ایم اے اشارے کو بطور ٹرگر شرط استعمال کرنا ، سگنل کی وشوسنییتا کو بڑھا سکتا ہے اور جھوٹے سگنل کی موجودگی کو کم کرسکتا ہے۔
- خطرے پر قابو پانا: سپر ٹرینڈ اشارے کے رجحانات کا اندازہ لگانے سے ، منفی حالات میں تجارت سے بچنے اور خطرے کو کم کرنے میں مدد ملتی ہے۔
- لچکدار: یہ حکمت عملی مختلف مارکیٹوں اور پرجاتیوں میں لاگو کی جاسکتی ہے ، جس میں بہتر موافقت اور لچک ہے۔
اسٹریٹجک رسک
- پیرامیٹرز کو بہتر بنانے کا خطرہ: سپر ٹرینڈ اشارے اور ای ایم اے اشارے کے پیرامیٹرز کی ترتیب حکمت عملی کی کارکردگی پر بہت زیادہ اثر ڈالتی ہے ، نامناسب پیرامیٹرز حکمت عملی کو ناکام بنانے کا سبب بن سکتے ہیں۔
- مارکیٹ میں اتار چڑھاؤ کا خطرہ: مارکیٹ میں شدید اتار چڑھاؤ کے دوران ، قلیل مدتی ای ایم اے اور درمیانی مدت کے ای ایم اے میں کثرت سے کراسنگ ہوسکتی ہے ، جس کی وجہ سے حکمت عملی میں متعدد غلط سگنل پیدا ہوتے ہیں۔
- رجحان کا رخ موڑنے کا خطرہ: جب مارکیٹ میں رجحان کا رخ موڑ جاتا ہے تو ، سپر ٹرینڈ اشارے پیچھے رہ سکتے ہیں ، جس کی وجہ سے حکمت عملی رجحان کی تبدیلی کے آغاز میں نقصان اٹھاتی ہے۔
حکمت عملی کی اصلاح کی سمت
- پیرامیٹرز کی اصلاح: بہترین پیرامیٹرز کا مجموعہ تلاش کرنے کے لئے سپر ٹرینڈ اشارے اور ای ایم اے اشارے کی مدت کے ضرب کو بہتر بنانے کے ذریعے حکمت عملی کی استحکام اور منافع کو بہتر بنائیں۔
- سگنل فلٹرنگ: ای ایم اے کراس سگنل پیدا ہونے کے بعد ، دوسرے تکنیکی اشارے (جیسے RSI ، MACD وغیرہ) کے ساتھ مل کر سگنل کی دوسری تصدیق کی جاسکتی ہے ، جس سے سگنل کی وشوسنییتا میں اضافہ ہوتا ہے۔
- نقصان کی روک تھام: ایک واحد تجارت کے خطرے کو کنٹرول کرنے اور حکمت عملی کے خطرے سے فائدہ اٹھانے کے تناسب کو بڑھانے کے لئے معقول نقصان کی روک تھام کا طریقہ کار متعارف کرایا گیا ہے۔
- کثیر نسل کثیر دورانیہ: اس حکمت عملی کو مختلف نسلوں اور دورانیوں پر لاگو کریں تاکہ سرمایہ کاری کو متنوع کرکے مجموعی طور پر خطرہ کم کیا جاسکے۔
خلاصہ کریں۔
سپر ٹرینڈ اور ای ایم اے کی مجموعی حکمت عملی سپر ٹرینڈ اشارے کو متعدد ای ایم اے اشارے کے ساتھ جوڑ کر ایک مکمل ٹرینڈ ٹریکنگ سسٹم تشکیل دیتی ہے۔ یہ حکمت عملی سپر ٹرینڈ اشارے کا استعمال کرکے مارکیٹ کے رجحانات کا فیصلہ کرتی ہے ، جبکہ ای ایم اے اشارے کے کراسنگ کی صورت حال سے خرید و فروخت کے اشارے پیدا کرتی ہے ، جس میں رجحانات کی پیروی کرنے کی طاقت ، سگنل کی تصدیق کی قابل اعتماد ، اور موافقت کی وسیع صلاحیت وغیرہ ہیں۔ تاہم ، حکمت عملی کو پیرامیٹرز کی اصلاح ، مارکیٹ میں اتار چڑھاؤ اور رجحان کی تبدیلی جیسے خطرات کا بھی سامنا کرنا پڑتا ہے ، حکمت عملی کی استحکام اور منافع بخش صلاحیت کو بڑھانے کے لئے پیرامیٹرز کی اصلاح ، سگنل فلٹرنگ ، اسٹاپ لاسٹ اسٹاپ اور کثیر نوعیت کے متعدد دوروں کے ذریعہ اصلاح اور بہتری کی ضرورت ہے۔
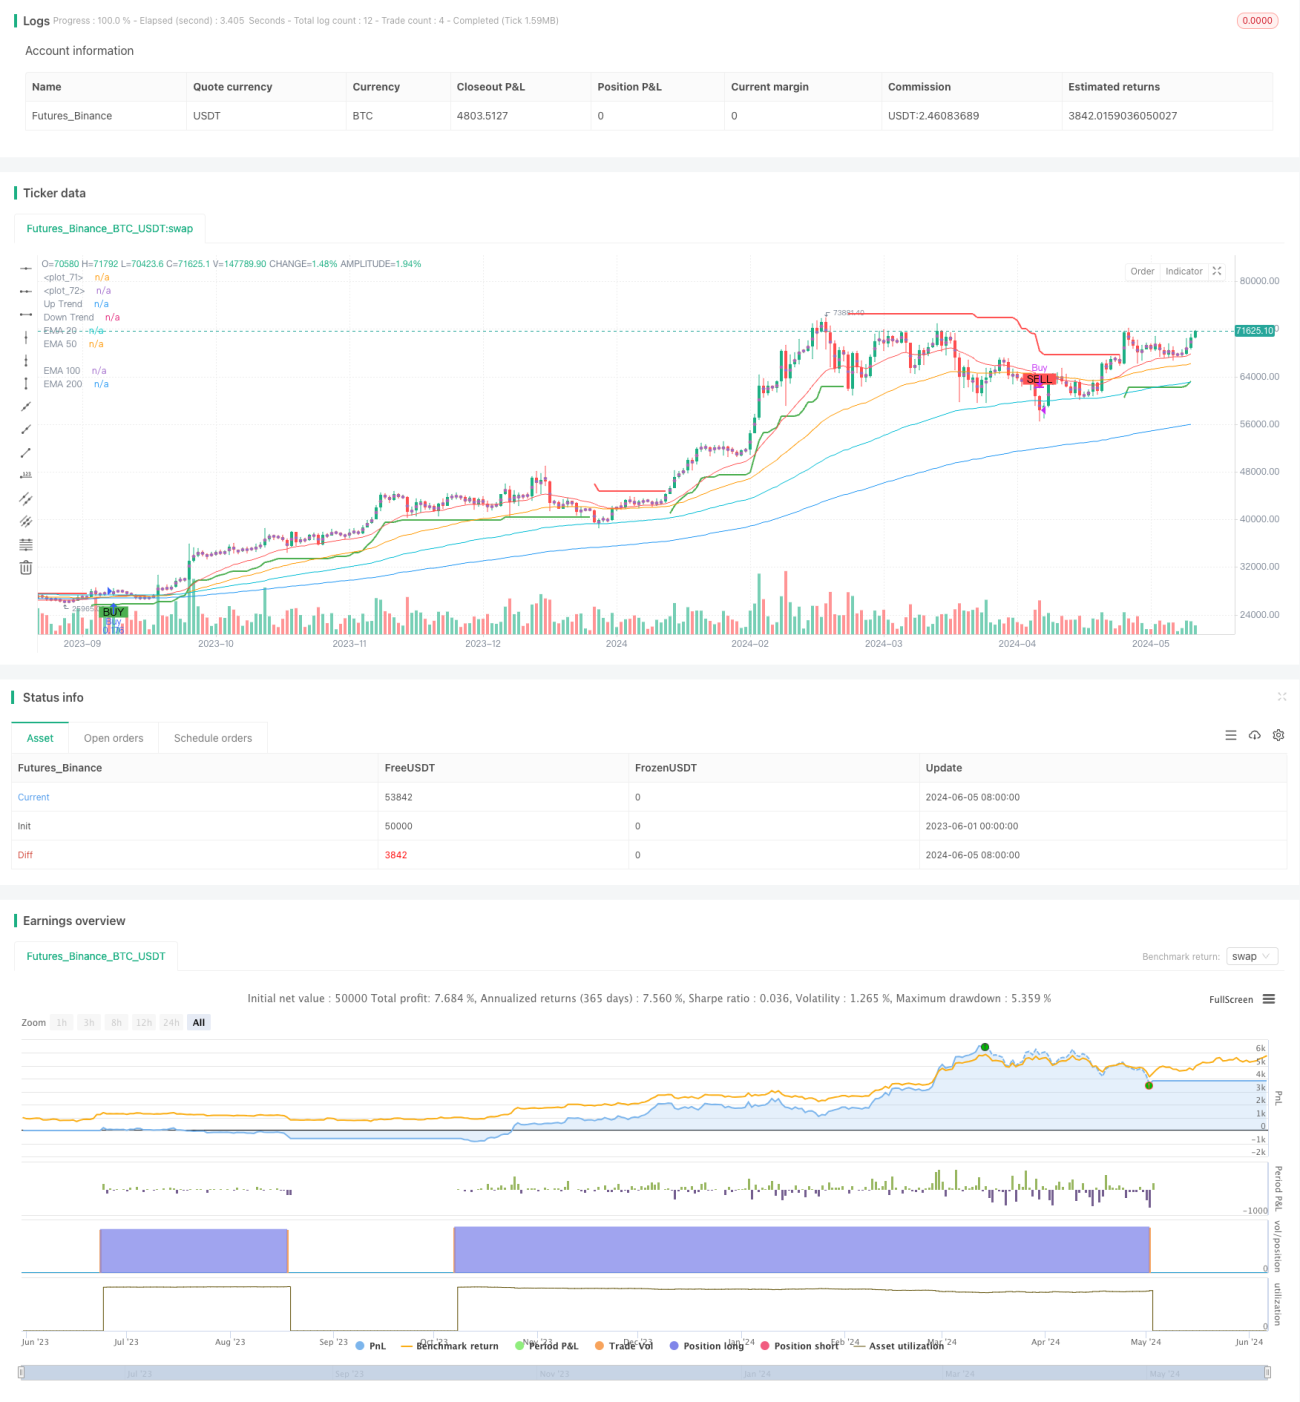
/*backtest
start: 2023-06-01 00:00:00
end: 2024-06-06 00:00:00
period: 1d
basePeriod: 1h
exchanges: [{"eid":"Futures_Binance","currency":"BTC_USDT"}]
*/

//@version=4
strategy("Supertrend EMA Strategy", overlay=true, default_qty_type=strategy.percent_of_equity, default_qty_value=10)

// Supertrend Parameters- 1