جائزہ
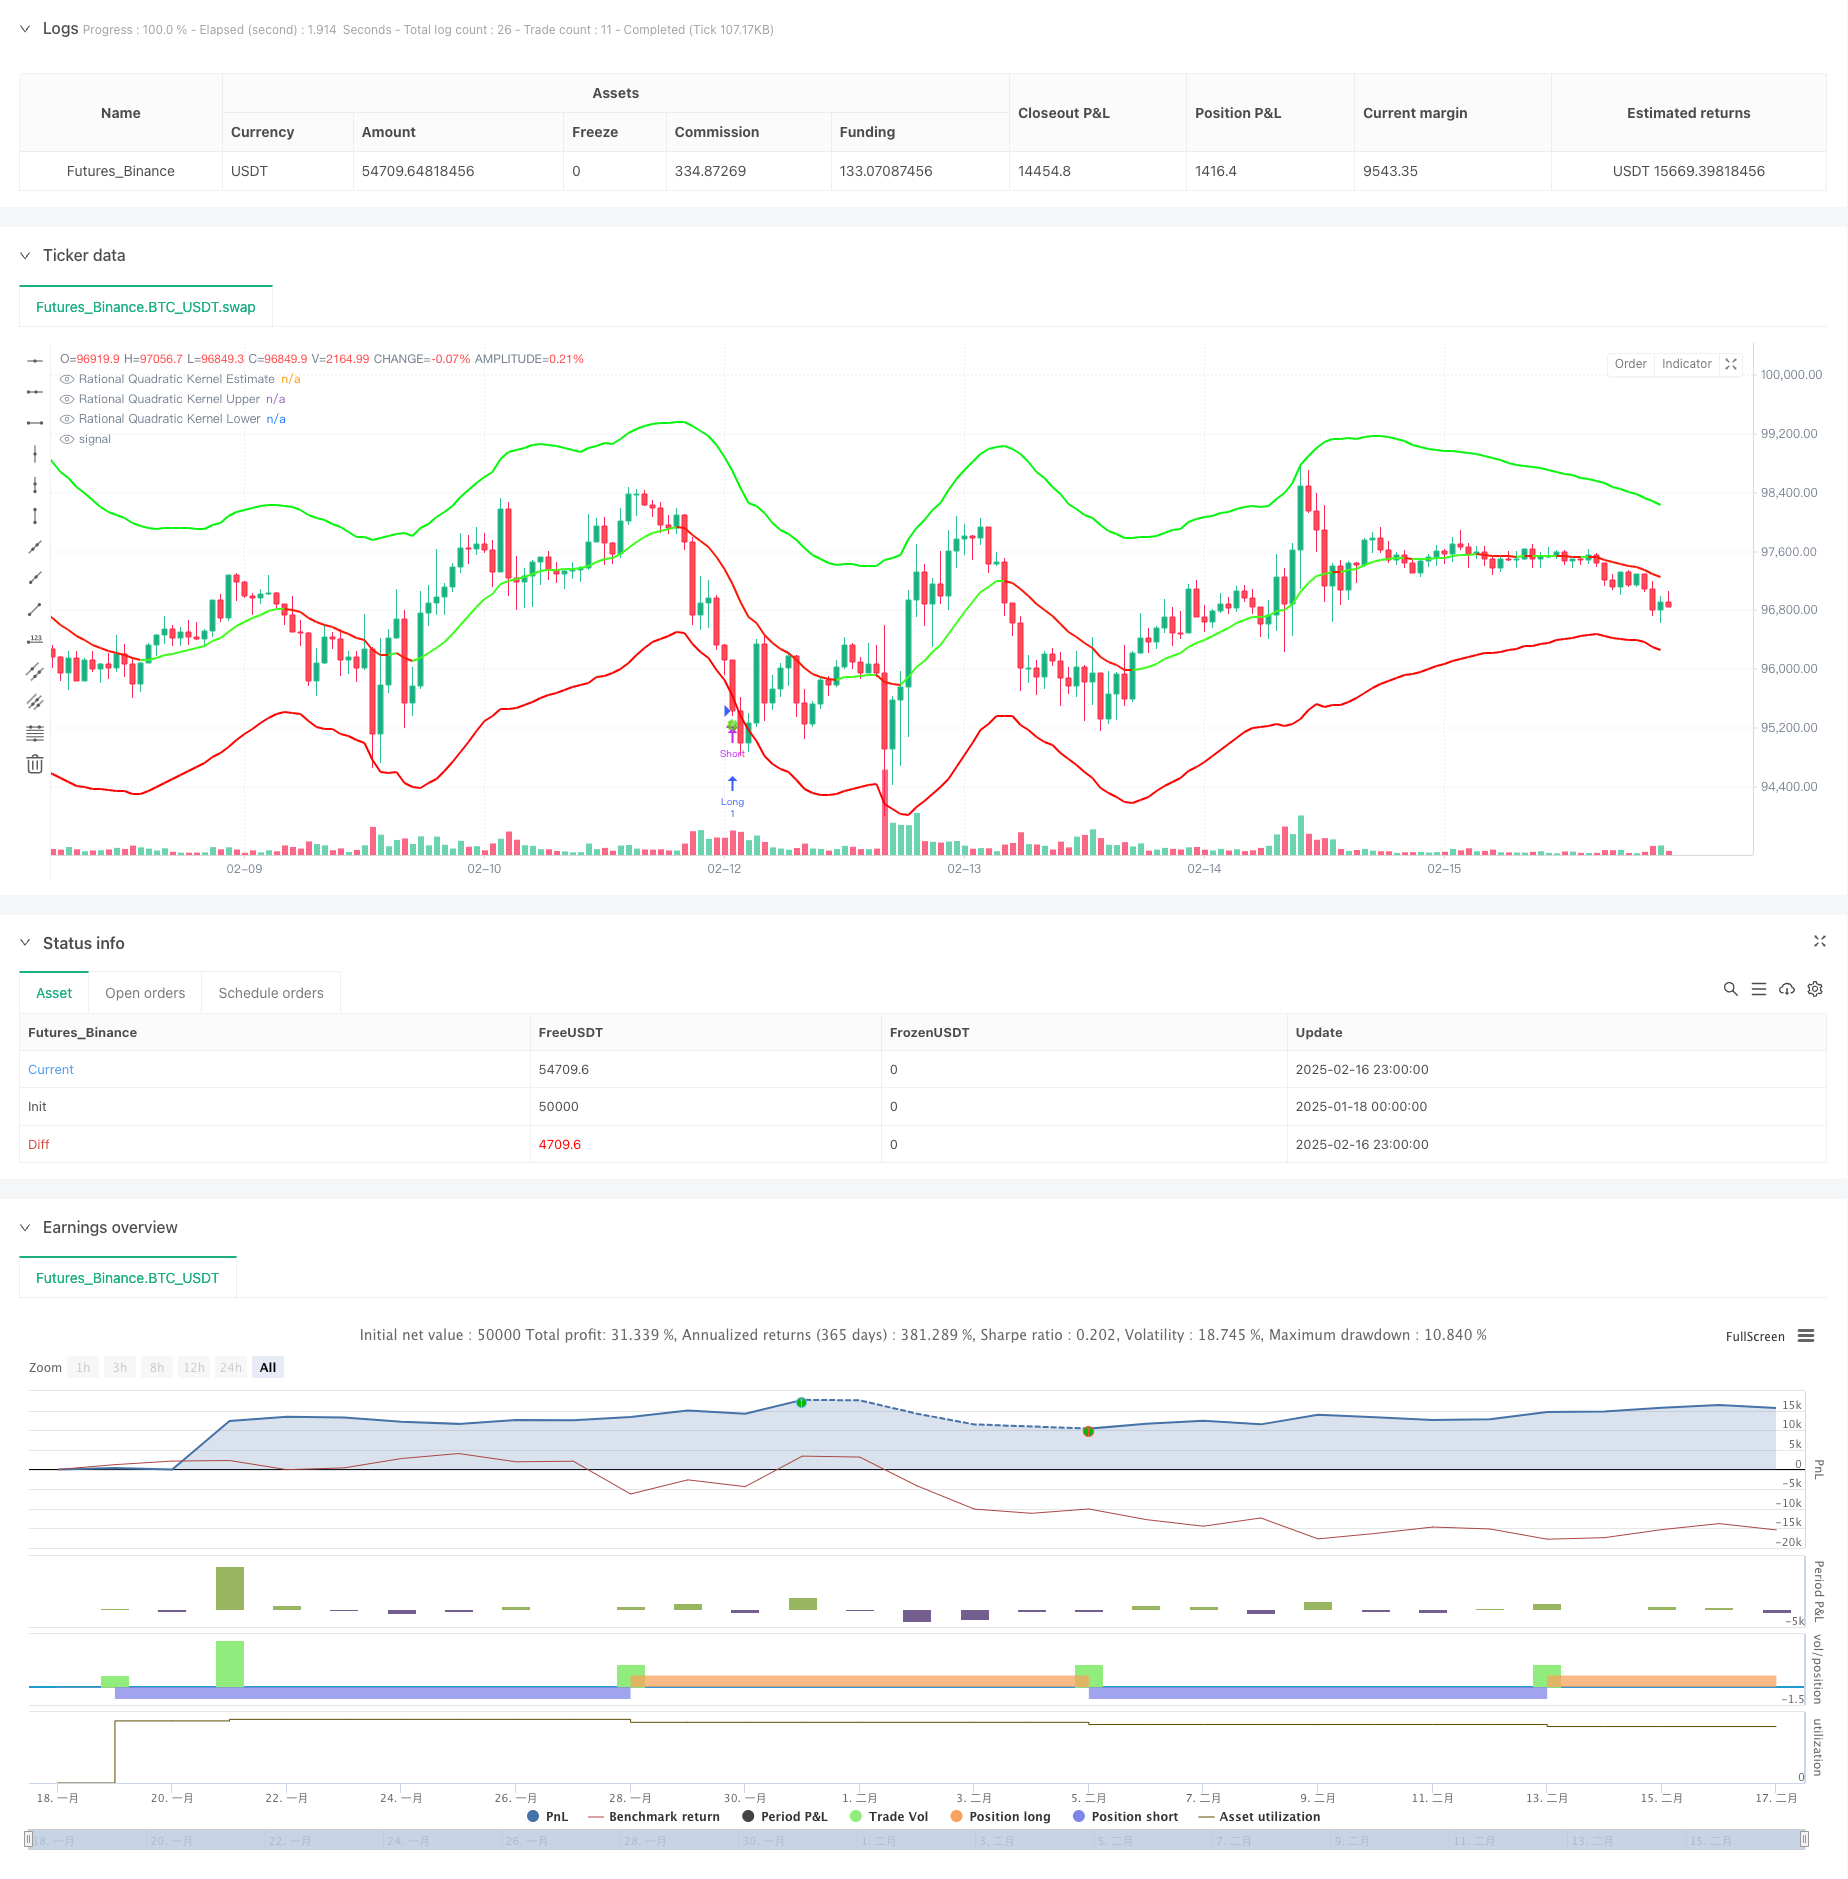
یہ حکمت عملی نادارایا-واٹسن کور ریگرینسی اور اے ٹی آر ڈائنامک بینڈ کے ساتھ مل کر ایک خود کار طریقے سے رجحان ٹریکنگ سسٹم ہے۔ یہ قیمتوں کے رجحانات کی پیش گوئی کرتا ہے اور اے ٹی آر پر مبنی متحرک معاونت اور مزاحمت کا استعمال کرتے ہوئے تجارتی مواقع کی نشاندہی کرتا ہے۔ یہ نظام مارکیٹ کے عین مطابق ماڈلنگ کو قابل ترتیب ریگرینس ونڈوز اور وزن والے پیرامیٹرز کے ذریعہ حاصل کرتا ہے۔
حکمت عملی کا اصول
حکمت عملی کا مرکز ناداریہ-واٹسن کے طریقہ کار پر مبنی غیر پیرامیٹرڈ نیوکلیئر ریگریشن ہے ، جس میں قیمت کی ترتیب کو ہموار کرنے کے لئے معقول دوہری کور فنکشن کا استعمال کیا جاتا ہے۔ ریگریشن کا حساب کتاب سیٹ شدہ ابتدائی بار سے شروع ہوتا ہے ، جس میں دو اہم پیرامیٹرز کو فٹ ہونے کی سطح کو کنٹرول کرنے کے لئے نظر ثانی شدہ ونڈو ((h) اور رشتہ دار وزن (®) کے ذریعہ کیا جاتا ہے۔ اس کے ساتھ ساتھ اے ٹی آر اشارے کے ساتھ مل کر ایک متحرک بینڈ کی تعمیر کی جاتی ہے ، جس میں اوپر اور نیچے والے بینڈ کو ریگریشن کے تخمینے میں اضافے اور اے ٹی آر کو کم کرنے کے ضرب کے طور پر الگ کیا جاتا ہے۔ نظام قیمت اور بینڈ کے کراسنگ کے ذریعے تجارت کے سگنل کو متحرک کرتا ہے۔ جب قیمت نیچے کی حد کو توڑتی ہے تو زیادہ کام کریں ، اور جب قیمت اوپر کی حد سے گزر جاتی ہے۔ رجحان کا تعین قیمت میں تبدیلی کی شرح یا کراسنگ میکانزم پر مبنی ہوسکتا ہے ، اور رنگ کی تبدیلی کے ذریعہ دکھایا جاتا ہے۔
اسٹریٹجک فوائد
- نیوکلیئر رجعت کا طریقہ کار ایک اچھی ریاضی کی بنیاد پر ہے جو قیمت کے رجحانات کو مؤثر طریقے سے پکڑ سکتا ہے بغیر زیادہ سے زیادہ فٹ ہونے کے
- متحرک طول و عرض مارکیٹ کے اتار چڑھاو کے ساتھ خود کار طریقے سے ایڈجسٹ کرتا ہے ، معاون مزاحمت کی زیادہ معقول سطح فراہم کرتا ہے
- پیرامیٹرز کو ترتیب دینے کے قابل ، مختلف مارکیٹ کی خصوصیات کے مطابق لچکدار
- رجحانات کی شناخت کے لئے ایک لچکدار طریقہ کار، ہموار یا حساس موڈ کا انتخاب
- بصری اثرات بدیہی ہیں، اور ٹریڈنگ سگنل واضح ہیں
اسٹریٹجک رسک
- غلط پیرامیٹرز کا انتخاب اوور فٹ یا لیگ کی وجہ سے ہوسکتا ہے
- ہلچل مچانے والی مارکیٹوں میں ممکنہ طور پر زیادہ ٹریڈنگ سگنل
- ATR ضارب کی غیر معقول ترتیب سے اسٹاپ نقصان بہت وسیع یا بہت تنگ ہوسکتا ہے
- ٹرینڈ ٹرانسمیشن کے دوران غلط سگنل ہوسکتا ہے یہ سفارش کی جاتی ہے کہ پیرامیٹرز کو بہتر بنانے کے لئے تاریخی پس منظر کا استعمال کیا جائے ، اور اس کی تصدیق کے لئے دوسرے اشارے کے ساتھ مل کر۔
حکمت عملی کی اصلاح کی سمت
- رجحانات کی تصدیق کے طور پر ٹرانزیکشن کی پیمائش متعارف کرایا
- موافقت پذیر پیرامیٹرز کی اصلاح کے لئے میکانزم تیار کریں
- بڑھتی ہوئی رجحان کی طاقت فلٹرز کم ہلچل مارکیٹ جھوٹے سگنل
- سٹاپ نقصان روکنے کے طریقہ کار کو بہتر بنانا اور منافع کی شرح میں اضافہ کرنا
- مارکیٹ کے ماحول کی درجہ بندی کو شامل کرنے پر غور کریں ، مختلف بازاروں میں مختلف پیرامیٹرز کا استعمال کریں
خلاصہ کریں۔
اسٹریٹجک سیکھنے کے طریقوں کو تکنیکی تجزیہ کے ساتھ جوڑ کر ، اسٹریٹجک سیکھنے کے طریقوں کو جوڑ کر ، ایک نظریاتی بنیاد پر ٹھوس ، عملی تجارت کا نظام تشکیل دیا گیا ہے۔ اس کی خودکشی کی خصوصیات اور تشکیل پذیری اس کو مختلف مارکیٹ کے حالات کے مطابق ڈھالنے کی اجازت دیتی ہے ، لیکن اس کا استعمال کرتے وقت پیرامیٹرز کی اصلاح اور خطرے پر قابو پانے پر توجہ دینے کی ضرورت ہے۔ اسٹریٹجک کو مستقل طور پر بہتر بنانے اور بہتر بنانے کے ذریعے ، اسٹریٹجک کو حقیقی جنگ میں تجارت میں اہم کردار ادا کرنے کی امید ہے۔
/*backtest
start: 2025-01-18 00:00:00
end: 2025-02-17 00:00:00
period: 1h
basePeriod: 1h
exchanges: [{"eid":"Futures_Binance","currency":"BTC_USDT"}]
*/

// This source code is subject to the terms of the Mozilla Public License 2.0 at https://mozilla.org/MPL/2.0/
// © Lupown

//@version=5
strategy("Nadaraya-Watson non repainting Strategy", overlay=true)  // PARAMETER timeframe ODSTRÁNENÝ

//--------------------------------------------------------------------------------
// INPUTS
//--------------------------------------------------------------------------------
src = input.source(close, 'Source')
h   = input.float(8., 'Lookback Window', minval=3., tooltip='The number of bars used for the estimation. This is a sliding value that represents the most recent historical bars. Recommended range: 3-50')
r   = input.float(8., 'Relative Weighting', step=0.25, tooltip='Relative weighting of time frames. As this value approaches zero, the longer time frames will exert more influence on the estimation. As this value approaches infinity, the behavior of the Rational Quadratic Kernel will become identical to the Gaussian kernel. Recommended range: 0.25-25')
x_0 = input.int(25, "Start Regression at Bar", tooltip='Bar index on which to start regression. The first bars of a chart are often highly volatile, and omission of these initial bars often leads to a better overall fit. Recommended range: 5-25')
showMiddle    = input.bool(true, "Show middle band")
smoothColors  = input.bool(false, "Smooth Colors", tooltip="Uses a crossover based mechanism to determine colors. This often results in less color transitions overall.", inline='1', group='Colors')
lag           = input.int(2, "Lag", tooltip="Lag for crossover detection. Lower values result in earlier crossovers. Recommended range: 1-2", inline='1', group='Colors')

lenjeje = input.int(32, "ATR Period",    tooltip="Period to calculate upper and lower band", group='Bands')
coef    = input.float(2.7, "Multiplier", tooltip="Multiplier to calculate upper and lower band", group='Bands')

//--------------------------------------------------------------------------------
// ARRAYS & VARIABLES
//--------------------------------------------------------------------------------
float y1 = 0.0
float y2 = 0.0
srcArray = array.new<float>(0)
array.push(srcArray, src)
size = array.size(srcArray)

//--------------------------------------------------------------------------------
// KERNEL REGRESSION FUNCTIONS
//--------------------------------------------------------------------------------
kernel_regression1(_src, _size, _h) =>
    float _currentWeight = 0.
    float _cumulativeWeight = 0.
    for i = 0 to _size + x_0
        y = _src[i]
        w = math.pow(1 + (math.pow(i, 2) / ((math.pow(_h, 2) * 2 * r))), -r)
        _currentWeight    += y * w
        _cumulativeWeight += w
    [_currentWeight, _cumulativeWeight]

[currentWeight1, cumulativeWeight1] = kernel_regression1(src, size, h)
yhat1 = currentWeight1 / cumulativeWeight1

[currentWeight2, cumulativeWeight2] = kernel_regression1(src, size, h - lag)
yhat2 = currentWeight2 / cumulativeWeight2

//--------------------------------------------------------------------------------
// TREND & COLOR DETECTION
//--------------------------------------------------------------------------------
// Rate-of-change-based
bool wasBearish   = yhat1[2] > yhat1[1]
bool wasBullish   = yhat1[2] < yhat1[1]
bool isBearish    = yhat1[1] > yhat1
bool isBullish    = yhat1[1] < yhat1
bool isBearishChg = isBearish  and wasBullish
bool isBullishChg = isBullish  and wasBearish

// Crossover-based (for "smooth" color changes)
bool isBullishCross  = ta.crossover(yhat2, yhat1)
bool isBearishCross  = ta.crossunder(yhat2, yhat1)
bool isBullishSmooth = yhat2 > yhat1
bool isBearishSmooth = yhat2 < yhat1

color c_bullish    = input.color(#3AFF17, 'Bullish Color', group='Colors')
color c_bearish    = input.color(#FD1707, 'Bearish Color', group='Colors')

color colorByCross = isBullishSmooth ? c_bullish : c_bearish
color colorByRate  = isBullish       ? c_bullish : c_bearish
color plotColor    = smoothColors ? colorByCross : colorByRate

// Middle Estimate
plot(showMiddle ? yhat1 : na, "Rational Quadratic Kernel Estimate", color=plotColor, linewidth=2)

//--------------------------------------------------------------------------------
// UPPER / LOWER BANDS
//--------------------------------------------------------------------------------
upperjeje = yhat1 + coef * ta.atr(lenjeje)
lowerjeje = yhat1 - coef * ta.atr(lenjeje)

plotUpper = plot(upperjeje, "Rational Quadratic Kernel Upper", color=color.rgb(0, 247, 8), linewidth=2)
plotLower = plot(lowerjeje, "Rational Quadratic Kernel Lower", color=color.rgb(255, 0, 0), linewidth=2)

//--------------------------------------------------------------------------------
// SYMBOLS & ALERTS
//--------------------------------------------------------------------------------
plotchar(ta.crossover(close, upperjeje),  char="🥀", location=location.abovebar, size=size.tiny)
plotchar(ta.crossunder(close, lowerjeje), char="🍀", location=location.belowbar, size=size.tiny)

// Alerts for Color Changes (estimator)
alertcondition(smoothColors ? isBearishCross : isBearishChg, title="Bearish Color Change", message="Nadaraya-Watson: {{ticker}} ({{interval}}) turned Bearish ▼")
alertcondition(smoothColors ? isBullishCross : isBullishChg, title="Bullish Color Change", message="Nadaraya-Watson: {{ticker}} ({{interval}}) turned Bullish ▲")

// Alerts when price crosses upper and lower band
alertcondition(ta.crossunder(close, lowerjeje), title="Price close under lower band", message="Nadaraya-Watson: {{ticker}} ({{interval}}) crossed under lower band 🍀")
alertcondition(ta.crossover(close, upperjeje),  title="Price close above upper band", message="Nadaraya-Watson: {{ticker}} ({{interval}}) Crossed above upper band 🥀")

//--------------------------------------------------------------------------------
// STRATEGY LOGIC (EXAMPLE)
//--------------------------------------------------------------------------------
if ta.crossunder(close, lowerjeje)
    // zatvoriť short
    strategy.close("Short")
    // otvoriť long
    strategy.entry("Long", strategy.long)

if ta.crossover(close, upperjeje)
    // zatvoriť long
    strategy.close("Long")
    // otvoriť short
    strategy.entry("Short", strategy.short)