
جائزہ
کثیر عنصر ALMA-ATR انکولی رجحان کی پیروی کی حکمت عملی ایک جامع تجارتی نظام ہے جو داخلی اور خارجی مواقع کو بہتر بنانے کے لیے متعدد تکنیکی اشاریوں کو یکجا کرتا ہے۔ اس حکمت عملی کا بنیادی حصہ ALMA کو رجحان کے تعین کے لیے استعمال کرتا ہے، جبکہ ATR کے اتار چڑھاؤ کی فلٹرنگ، RSI کی رفتار کی تصدیق، ADX کی رجحان کی طاقت کی جانچ، اور بولنگر بینڈ کے اتار چڑھاؤ کے کنٹرول کے طریقہ کار کو بھی شامل کیا گیا ہے۔ اس حکمت عملی میں UT Bot نظام بھی ضم کیا گیا ہے، جو ATR پر مبنی ٹریلنگ سٹاپ اور سگنل سسٹم ہے، تاکہ تجارتی اخراج کی درستگی کو بہتر بنایا جا سکے۔
حکمت عملی کا اصول
اس حکمت عملی کا بنیادی اصول متعدد تکنیکی اشاریوں کے باہمی تعاون کے ذریعے تجارت کرنا ہے، جب رجحان واضح ہو اور اتار چڑھاؤ مناسب ہو۔ خاص طور پر:
- ALMA کو مرکزی رجحانی اشاریے کے طور پر استعمال کیا جاتا ہے، جو روایتی EMA یا SMA کے مقابلے میں زیادہ ہموار اور کم تاخیر والا ہے۔
- اتار چڑھاؤ کی فلٹرنگ لاگو کی جاتی ہے: ATR کی قدر مقررہ کم از کم حد سے زیادہ ہونی چاہیے، تاکہ مارکیٹ میں کافی حرکت یقینی ہو۔
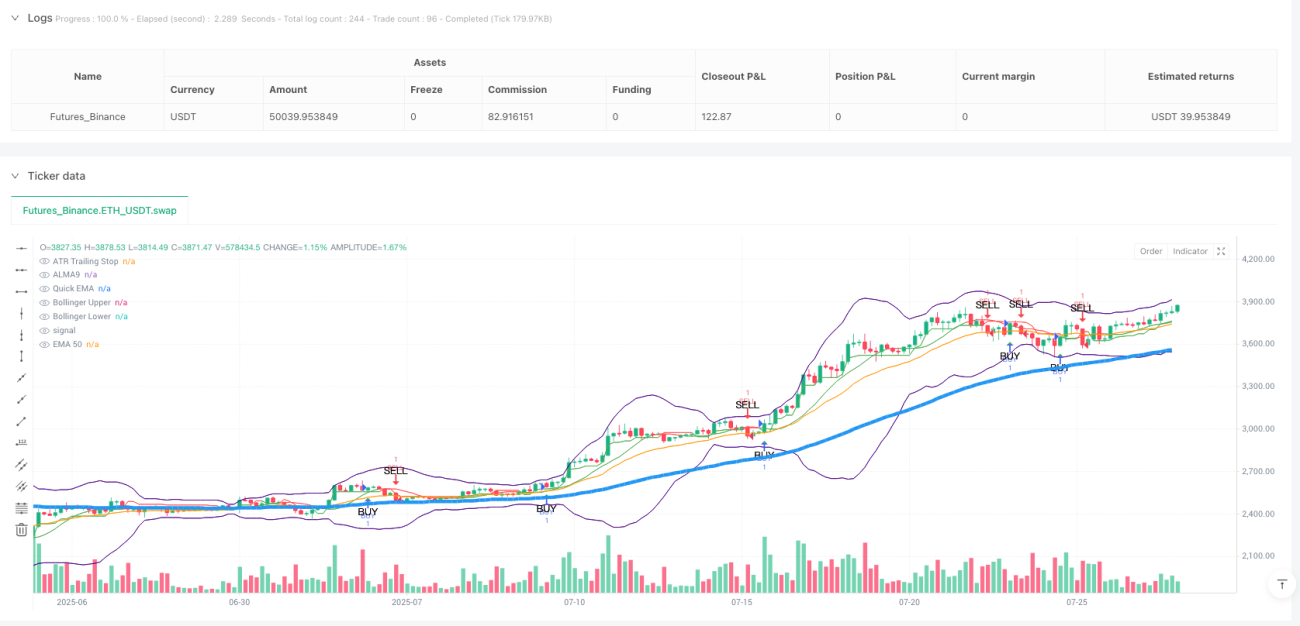
- داخلے کی شرائط میں شامل ہیں: قیمت EMA50 اور ALMA9 سے اوپر ہو، RSI حد سے زیادہ فروخت کی سطح سے اوپر اور 30 سے زیادہ ہو، ADX 30 سے زیادہ ہو (جو مضبوط رجحان کی نشاندہی کرتا ہے)، قیمت بولنگر بینڈ کی اوپری حد سے نیچے ہو، اور ٹھنڈک کی مدت کی شرط پوری ہو۔
- خارج ہونے کی شرائط: قیمت تیز رفتار EMA سے نیچے آ جائے، یا ATR پر مبنی سٹاپ لاس/ٹیک پرافٹ متحرک ہو، یا وقت کی حد پر مبنی باہر نکلیں۔
- UT Bot نظام کو مربوط کیا گیا ہے، جو ATR پر مبنی ٹریلنگ سٹاپ لائن کا استعمال کرتا ہے، تاکہ تجارت کو اضافی تحفظ فراہم کیا جا سکے۔
یہ حکمت عملی متحرک رسک مینجمنٹ کا طریقہ کار اپناتی ہے، جہاں سٹاپ لاس اور ٹیک پرافٹ کی سطحیں ATR پر مبنی ہوتی ہیں، جس سے حکمت عملی مختلف مارکیٹ حالات میں اتار چڑھاؤ کے مطابق ڈھل سکتی ہے۔
فوائد کا تجزیہ
اس حکمت عملی کے کئی نمایاں فوائد ہیں:
- متعدد تصدیقی طریقہ کار: متعدد تکنیکی اشاریوں (ALMA، RSI، ADX، بولنگر بینڈ وغیرہ) کو یکجا کر کے سگنلز کی وشوسنییتا بڑھائی جاتی ہے اور جھوٹے سگنلز کم ہوتے ہیں۔
- زیادہ انکولی: ATR پر مبنی متحرک سٹاپ لاس اور ٹیک پرافٹ کی سطحیں حکمت عملی کو مارکیٹ کے اتار چڑھاؤ کے مطابق ڈھلنے کی اجازت دیتی ہیں۔
- موثر رجحان کی گرفت: ALMA کی کم تاخیر کی خاصیت، ADX کے رجحان کی طاقت کی تصدیق کے ساتھ مل کر، رجحان کی تبدیلیوں کو بروقت پکڑنے میں مدد دیتی ہے۔
- مکمل رسک کنٹرول: اتار چڑھاؤ کی فلٹرنگ، متحرک سٹاپ لاس، اور ٹھنڈک کی مدت کے ذریعے کثیر سطحی تحفظ فراہم کیا جاتا ہے۔
- واضح تصور: حکمت عملی چارٹ پر خرید و فروخت کے سگنلز کو نشان زد کرتی ہے، جس سے تاجر آسانی سے مارکیٹ کی صورتحال سمجھ سکتے ہیں۔
- اعلیٰ لچک: پیرامیٹرز کو ایڈجسٹ کر کے حکمت عملی کو مختلف مارکیٹ حالات اور تجارتی ادوار کے مطابق ڈھالا جا سکتا ہے۔
خطرات کا تجزیہ
اگرچہ یہ حکمت عملی کافی جامع ہے، لیکن اس میں کچھ ممکنہ خطرات موجود ہیں:
- پیرامیٹر کی اصلاح کا خطرہ: پیرامیٹرز کو زیادہ بہتر بنانے سے تاریخی ڈیٹا پر اچھی کارکردگی ہو سکتی ہے، لیکن حقیقی تجارت میں ناقص نتائج برآمد ہو سکتے ہیں۔
حل: فارورڈ ٹیسٹنگ اور نمونے سے باہر کے ڈیٹا کا استعمال کرتے ہوئے پیرامیٹرز کی مضبوطی کو یقینی بنائیں۔ - رجحان کے الٹ جانے کا خطرہ: مضبوط رجحان کے الٹ جانے پر حکمت عملی جلدی رد عمل نہیں دکھا سکتی، جس سے منافع ختم ہو سکتا ہے۔
حل: رجحان کے الٹ جانے کے انتباہی اشاریوں جیسے مومینٹم آسکیلیٹر یا حجم کا تجزیہ شامل کرنے پر غور کریں۔ - حد سے زیادہ تجارت کا خطرہ: افقی مارکیٹ میں بہت زیادہ تجارتی سگنلز پیدا ہو سکتے ہیں۔
حل: اتار چڑھاؤ کی فلٹرنگ کی شرائط کو مضبوط کریں، یا افقی مارکیٹ کی شناخت کے بعد تجارت روک دیں۔ - سٹاپ لاس کے جال کا خطرہ: مارکیٹ سٹاپ لاس کو چھو کر دوبارہ اصل رجحان میں آ سکتی ہے۔
حل: تقسیم شدہ سٹاپ لاس کی حکمت عملی استعمال کریں یا مختلف مارکیٹ حالات کے لیے سٹاپ لاس کے ضرب کو متحرک طور پر ایڈجسٹ کریں۔ - تاخیر کا خطرہ: اگرچہ ALMA میں تاخیر کم ہے، لیکن تمام تکنیکی اشاریوں میں کچھ نہ کچھ تاخیر ہوتی ہے۔
حل: مستقبل کی طرف دیکھنے والے اشاریوں کو شامل کرنے یا ALMA کے پیرامیٹرز کو بہتر بنانے پر غور کریں۔
بہتری کی سمت
حکمت عملی کے تجزیے کی بنیاد پر، درج ذیل بہتری کی سمتوں کی سفارش کی جاتی ہے:
- مارکیٹ کی حالت کی درجہ بندی: مارکیٹ کی حالت کی شناخت کا نظام متعارف کروائیں، تاکہ مختلف مارکیٹ حالات (رجحان، افقی، زیادہ اتار چڑھاؤ وغیرہ) میں مختلف پیرامیٹر سیٹ استعمال کیے جا سکیں۔ اس سے حکمت عملی کی مختلف مارکیٹ ماحول میں موافقت بہتر ہوگی۔
- حجم کا انضمام: حجم کے اشاریے کو حکمت عملی میں شامل کریں، تاکہ رجحان کی تصدیق کے لیے ایک معاون آلہ ہو۔ اس سے سگنلز کی وشوسنییتا بڑھے گی۔
- متعدد ٹائم فریم تجزیہ: متعدد ٹائم فریموں کی تصدیق کا طریقہ کار متعارف کروائیں، تاکہ تجارتی سمت زیادہ ٹائم فریم کے رجحان سے مطابقت رکھے۔
- مشین لرننگ سے بہتری: مشین لرننگ الگورتھم استعمال کر کے پیرامیٹرز کو متحرک طور پر ایڈجسٹ کریں، یا بہترین داخلے/خارجے کے مقامات کی پیش گوئی کریں۔
- ٹیک پرافٹ کی حکمت عملی میں بہتری: تقسیم شدہ ٹیک پرافٹ یا مارکیٹ کی ساخت پر مبنی متحرک ٹیک پرافٹ لاگو کریں، تاکہ سرمائے کے استعمال کی کارکردگی بہتر ہو۔
- سگنل کے معیار کی درجہ بندی: سگنل کے معیار کی درجہ بندی کا نظام تیار کریں، اور صرف اس وقت تجارت کریں جب سگنل کی طاقت مخصوص حد سے زیادہ ہو۔
- ڈرا ڈاؤن کنٹرول میں بہتری: مجموعی پوزیشن سائز کنٹرول کا طریقہ کار متعارف کروائیں، تاکہ جب ڈرا ڈاؤن مخصوص حد سے زیادہ ہو تو پوزیشن کم کریں یا تجارت روک دیں۔
ان بہتری کی سمتوں کا مقصد حکمت عملی کی مضبوطی کو بڑھانا، ڈرا ڈاؤن کو کم کرنا، اور مختلف مارکیٹ حالات میں یکساں کارکردگی برقرار رکھنا ہے۔
خلاصہ
کثیر عنصر ALMA-ATR انکولی رجحان کی پیروی کی حکمت عملی ایک جامع اور رسک کنٹرول میں مکمل تجارتی نظام ہے۔ ALMA، ATR، RSI، ADX، بولنگر بینڈ اور UT Bot جیسے متعدد تکنیکی آلات کو یکجا کر کے، یہ حکمت عملی رجحان کی شناخت، شور کو فلٹر کرنے، رسک کو کنٹرول کرنے، اور مناسب وقت پر داخلے اور خارج ہونے میں مؤثر ہے۔ حکمت عملی کا بنیادی فائدہ اس کے متعدد تصدیقی طریقہ کار اور انکولی رسک مینجمنٹ سسٹم میں ہے، جو اسے مختلف مارکیٹ ماحول میں مستحکم کارکردگی دکھانے کے قابل بناتا ہے۔
اس کے باوجود، کسی بھی تجارتی حکمت عملی کو مارکیٹ کی غیر یقینی صورتحال کے چیلنجز کا سامنا کرنا پڑتا ہے۔ پیرامیٹرز کی مسلسل بہتری، مارکیٹ کی حالت کی درجہ بندی، اور متعدد ٹائم فریم تجزیہ جیسے طریقوں سے اس حکمت عملی میں بہتری کی گنجائش موجود ہے۔ مقداری تاجروں کے لیے، یہ ایک اچھی بنیاد فراہم کرتی ہے جسے ذاتی خطرے کی برداشت اور مارکیٹ کی سمجھ کے مطابق مزید حسب ضرورت بنایا جا سکتا ہے۔
- 1