
0
Follow
0
Followers
Bollinger Bands, tại sao dữ liệu Bollinger Bands thu được từ TA.BOLL lại khác nhiều so với dữ liệu Bollinger Bands thu được từ việc xem xét đường K? Vui lòng giúp đỡ
Created 2021-02-25 19:47:20
6
1507
Lấy mã dữ liệu của Brin
def get_boll(self, period = PERIOD_M1 ,variance = 2):
self.upLine = '---'
self.midLine = '---'
self.downLine = '---'
r = exchange.GetRecords(period)
if r and len(r) > 20:
boll = TA.BOLL(r, 20, 2)
self.upLine = boll[0]
self.midLine = boll[1]
self.downLine = boll[2]
log ra 2021-2-23 19:10 Brin trên và dưới đường ray số -1, -2, -3:

Ví dụ: 2021-2-23 19:10 Brin có giá trị 48995
Tuy nhiên, khi nhìn lại đường K, một phút BB <unk> 20,2) có giá trị trên đường ray là 48457.
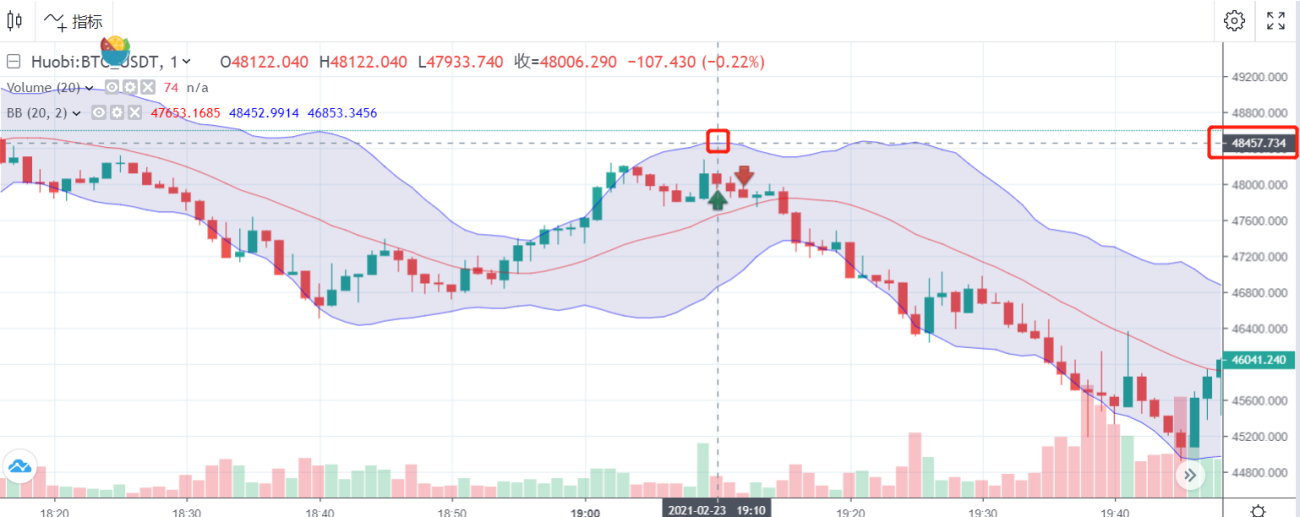
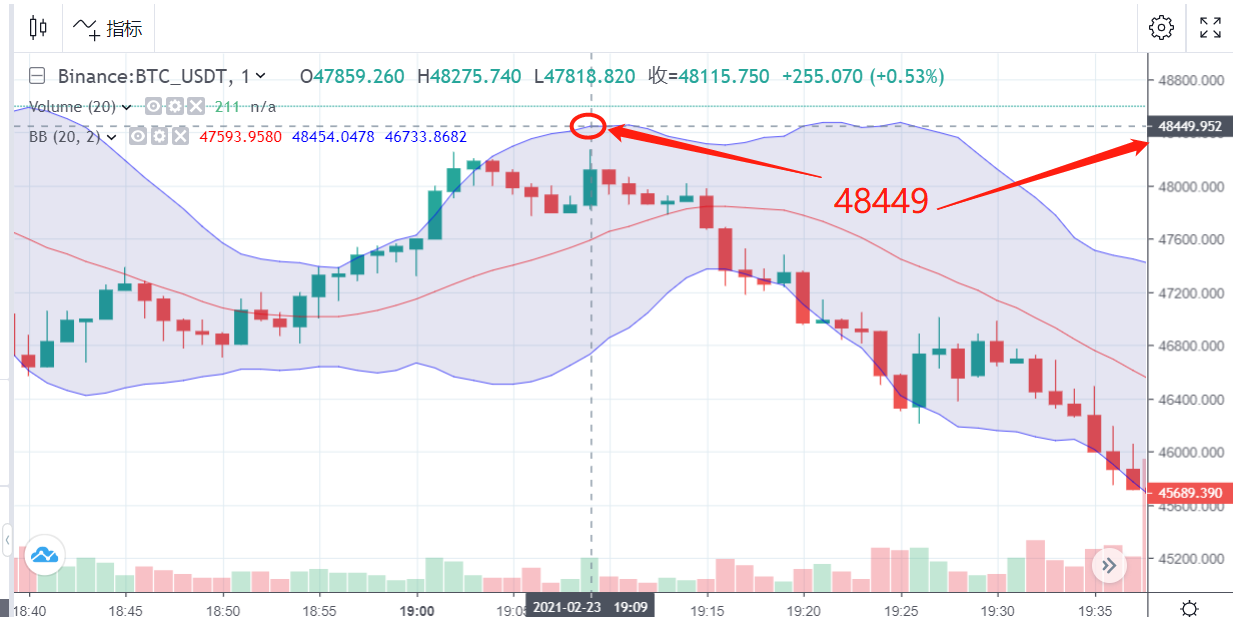
Hai giá trị sai hơn 500. Tôi điều chỉnh đường K của đồng xu xuống, và tại thời điểm này 1 phút K đường BB ((20,2) giá trị trên đường ray cũng là khoảng 48457.
Tôi biết tôi nên sử dụng câu hỏi, nhưng câu hỏi ở đâu, xin giúp đỡ.
Related Recommendations
How to Specify Different Versions of Data for the Rented Strategy by Its Rental Code MetadataAdvanced Tutorial for FMZ Quant platform Strategy WritingElementary Tutorial for FMZ Quant platform Strategy WritingGet Started with FMZ Quant PlatformSECURITY BUGI keep getting error: Exchange_GetAccount: Invalid ContractTypeWe have an incredibly profitable market making algorithm for sideways markets on Bitmex - but need expert to help eliminate wait times during downward volatility in the marketError with deribitLimitations of the backtesting engineHow to install ta-lib on linux docker?
Comment
All comments (6)



- 1