Chiến lược siêu xu hướng tốt nhất
Tác giả:ChaoZhang, Ngày: 2023-09-09 22:18:31Tags:
 Chiến lược siêu xu hướng là một chiến lược giao dịch đơn giản và hiệu quả có thể được sử dụng để kiếm lợi từ cả thị trường xu hướng tăng và xu hướng giảm. Chiến lược dựa trên chỉ số siêu xu hướng, đó là một chỉ số theo xu hướng giúp xác định xu hướng hiện tại và các điểm đảo ngược tiềm năng.
Chiến lược siêu xu hướng tốt nhất là một sửa đổi của chiến lược siêu xu hướng tiêu chuẩn sử dụng yếu tố và thời gian cao hơn. Điều này làm cho chỉ số nhạy cảm hơn với những thay đổi trong xu hướng và có thể giúp xác định các cơ hội giao dịch có lợi hơn.
Chiến lược này hoạt động bằng cách nhập các giao dịch dài khi giá vượt qua đường siêu xu hướng và thoát khỏi các giao dịch dài khi giá vượt qua đường siêu xu hướng. Các giao dịch ngắn được nhập khi giá vượt qua đường siêu xu hướng và thoát khi giá vượt qua đường siêu xu hướng.
Chiến lược siêu xu hướng tốt nhất là một chiến lược đơn giản và hiệu quả có thể được sử dụng bởi các nhà giao dịch ở mọi cấp độ kinh nghiệm. Chiến lược này cũng có rủi ro tương đối thấp, vì nó sử dụng stop loss để hạn chế lỗ.
Dưới đây là một số lợi ích của việc sử dụng Chiến lược siêu xu hướng tốt nhất:
Đơn giản và dễ hiểu Hiệu quả trên cả thị trường xu hướng tăng và xu hướng giảm Rủi ro thấp Lợi nhuận Nếu bạn đang tìm kiếm một chiến lược giao dịch đơn giản và hiệu quả, Chiến lược siêu xu hướng tốt nhất là một lựa chọn tuyệt vời. Chiến lược này dễ học và sử dụng, và nó có tiềm năng tạo ra lợi nhuận trong cả thị trường xu hướng tăng và giảm.
Dưới đây là một số mẹo để sử dụng Chiến lược siêu xu hướng tốt nhất:
Sử dụng một yếu tố và thời gian cao để làm cho chỉ số nhạy cảm hơn với những thay đổi trong xu hướng. Sử dụng dừng lỗ để hạn chế lỗ. Giao dịch với kích thước nhỏ để quản lý rủi ro. Kiểm tra lại chiến lược trên dữ liệu lịch sử để xem nó hoạt động như thế nào. Chiến lược siêu xu hướng tốt nhất là một cách tuyệt vời để bắt đầu giao dịch. Đây là một chiến lược đơn giản và hiệu quả có thể được sử dụng bởi các nhà giao dịch ở tất cả các cấp độ kinh nghiệm. Nếu bạn đang tìm kiếm một cách để kiếm lợi nhuận từ thị trường, Chiến lược siêu xu hướng tốt nhất là một lựa chọn tuyệt vời.
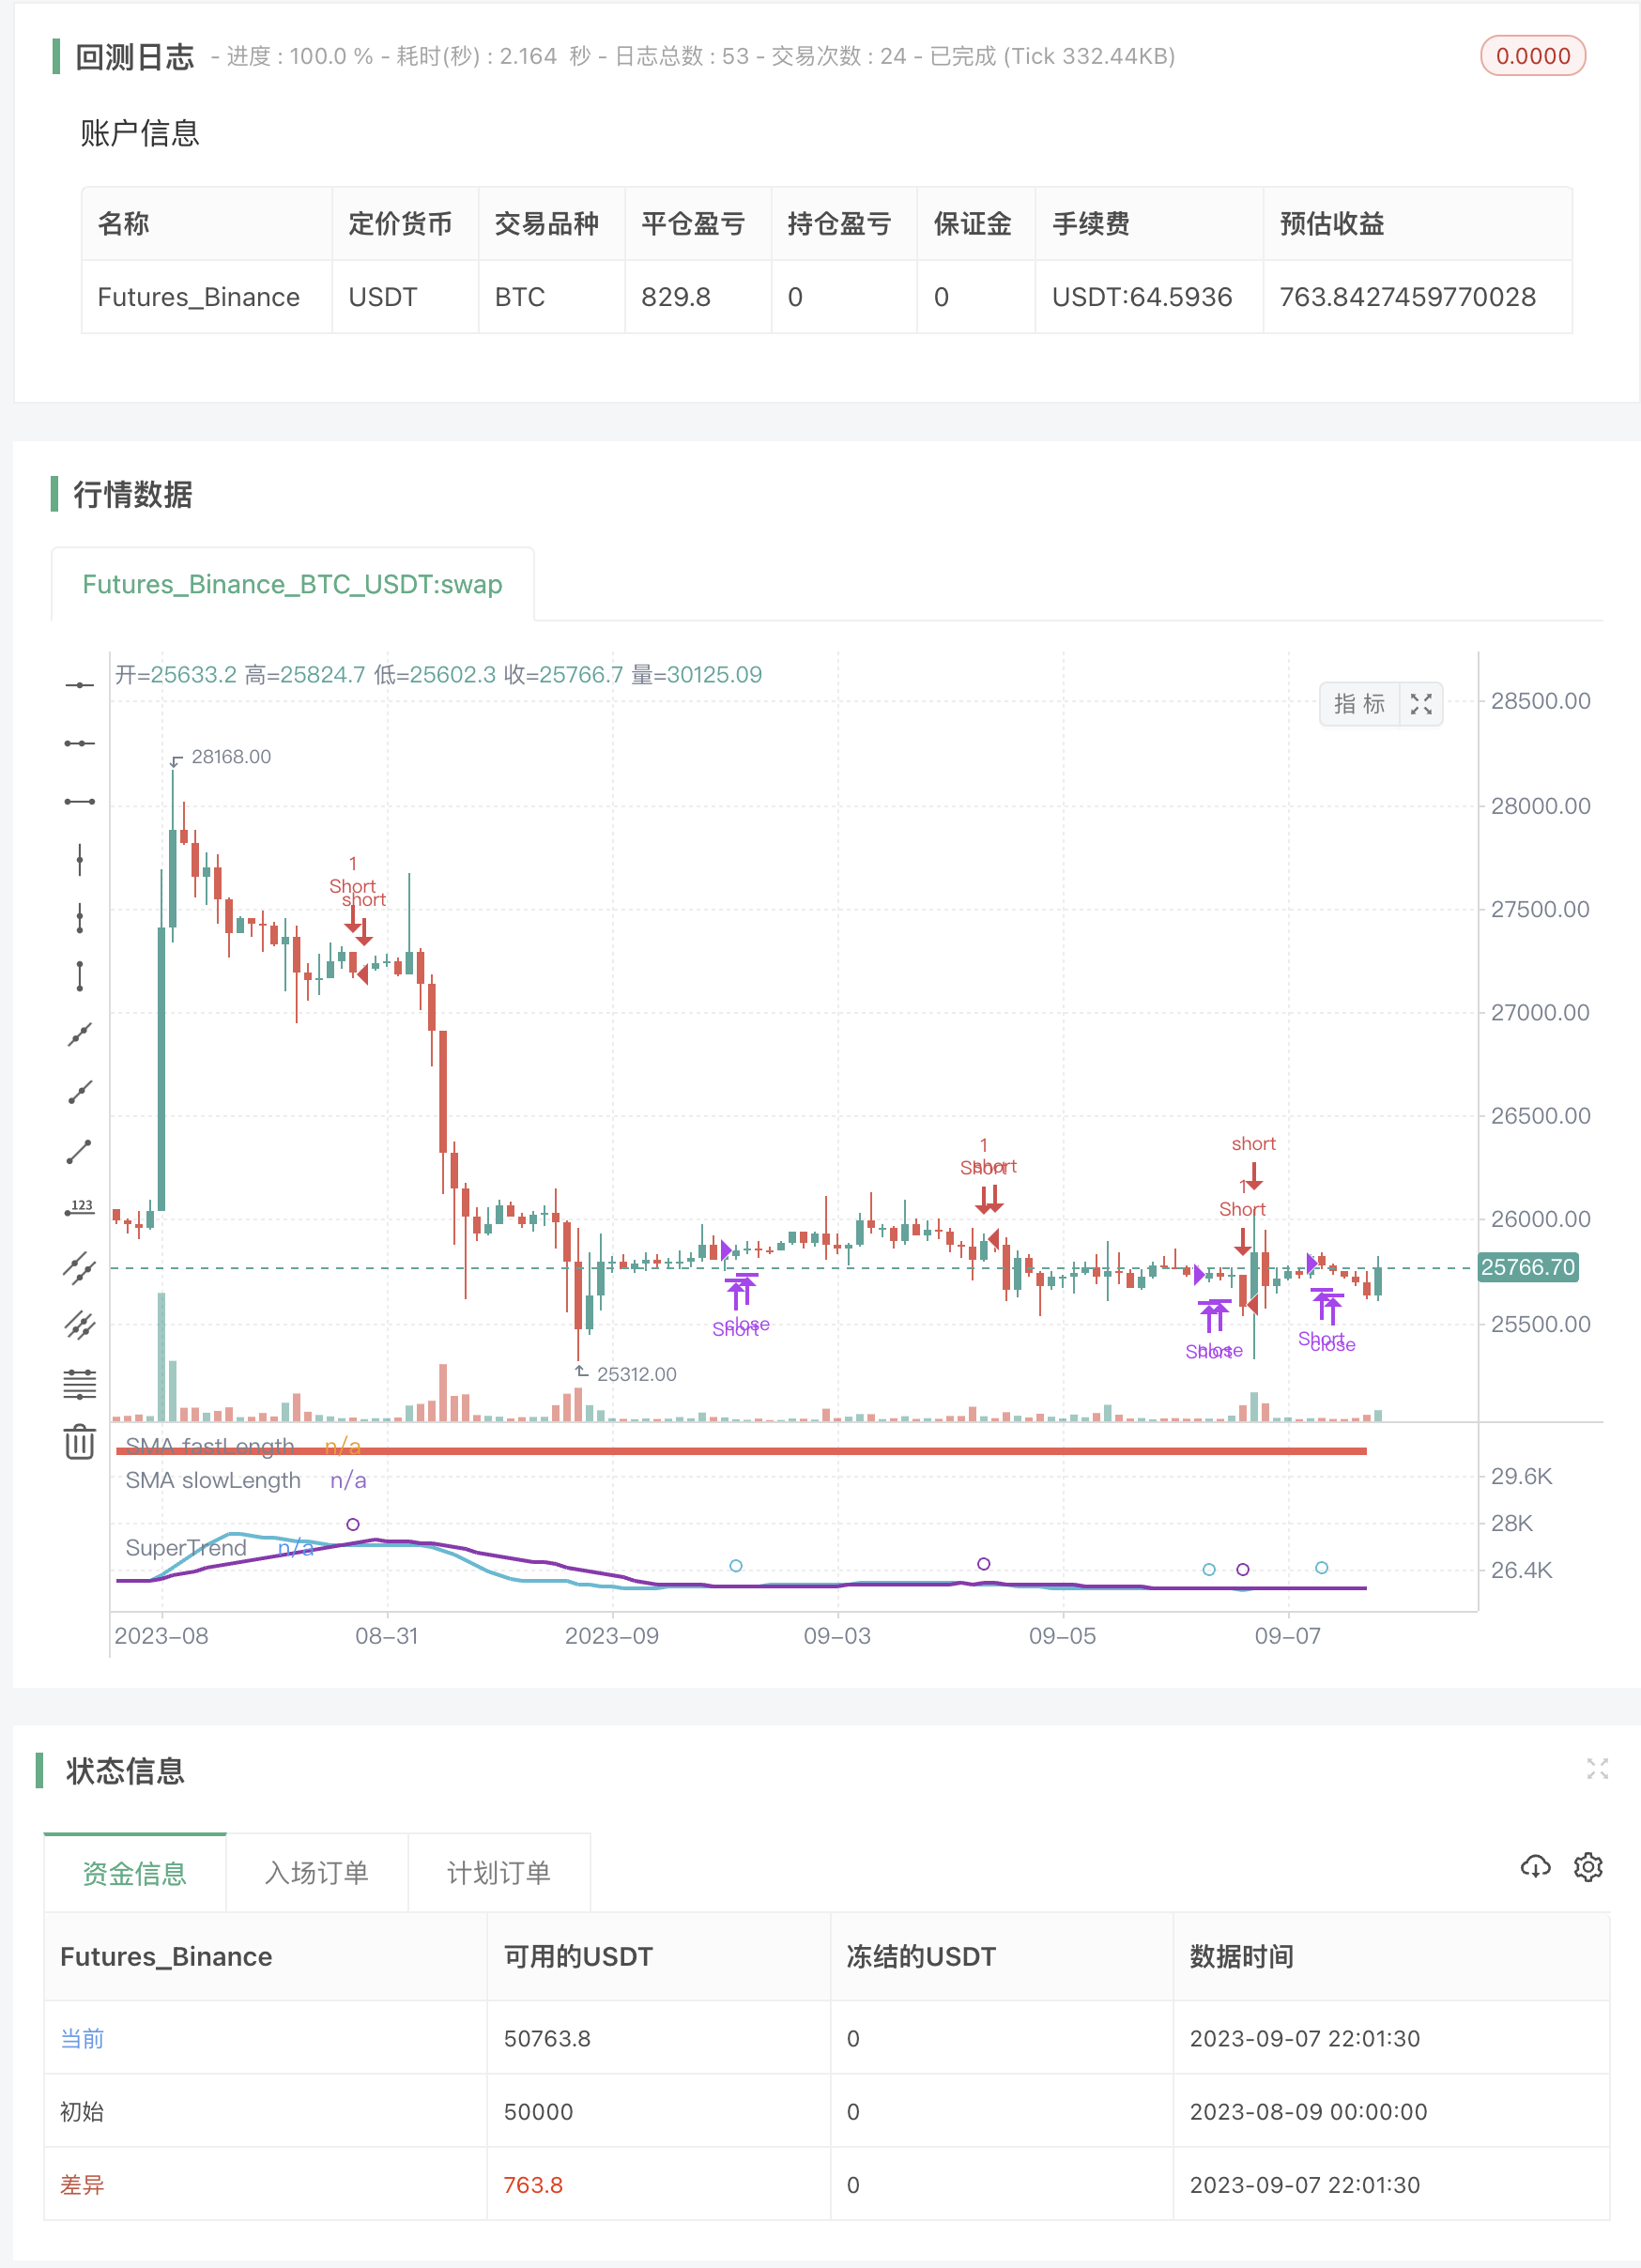
/*backtest
start: 2023-08-09 00:00:00
end: 2023-09-08 00:00:00
period: 2h
basePeriod: 15m
exchanges: [{"eid":"Futures_Binance","currency":"BTC_USDT"}]
args: [["v_input_4",2]]
*/

//@version=4
//@author=Daveatt

// strategy(title="BEST Supertrend Strategy", shorttitle="Supertrend Strategy", overlay=true,
//  pyramiding=0, default_qty_value=100, precision=7, currency=currency.USD,
//  commission_value=0.2,commission_type=strategy.commission.percent, initial_capital=1000000)


///////////////////////////////////////////////////////////////////////////////
///////////////////////////////////////////////////////////////////////////////
/////////////////////////// Strategy Component /////////////////////////////////
///////////////////////////////////////////////////////////////////////////////
///////////////////////////////////////////////////////////////////////////////

orderType = input("Longs+Shorts",title="What type of Orders", options=["Longs+Shorts","LongsOnly","ShortsOnly"])
isLong   = (orderType != "ShortsOnly")
isShort  = (orderType != "LongsOnly")

// SMA
fastLength = input(7, title="Fast Length SMA")
slowLength = input(20, title="Slow Length SMA")

///////////////////////////////////////////////////////////////////////////////
///////////////////////////////////////////////////////////////////////////////
///////////////////////////// SUPERTREND /////////////////////////////////////
///////////////////////////////////////////////////////////////////////////////
///////////////////////////////////////////////////////////////////////////////

Factor=input(3,title="[ST] Factor", minval=1,maxval = 100, type=input.float)
Pd=input(3, title="[ST] PD", minval=1,maxval = 100)
TF=input("daily", title="Supertrend timeframe", options=["daily","weekly","monthly","quartly","yearly"])

//////////////////////////
//* COLOR CONSTANTS *//
//////////////////////////

AQUA = #00FFFFFF
BLUE = #0000FFFF
RED  = #FF0000FF
LIME = #00FF00FF
GRAY = #808080FF
DARKRED   = #8B0000FF
DARKGREEN = #006400FF
GOLD = #FFD700
WHITE = color.white

// Plots
GREEN_LIGHT     = color.new(color.green, 40)
RED_LIGHT       = color.new(color.red, 40)
BLUE_LIGHT      = color.new(color.aqua, 40)
PURPLE_LIGHT    = color.new(color.purple, 40)


///////////////////////////////////////////////////////////////////////////////
///////////////////////////////////////////////////////////////////////////////
/////////////////////// SUPERTREND DETECTION //////////////////////////////////
///////////////////////////////////////////////////////////////////////////////
///////////////////////////////////////////////////////////////////////////////

f_supertrend(Factor, Pd) =>

    Up=hl2-(Factor*atr(Pd))
    Dn=hl2+(Factor*atr(Pd))

    TrendUp = 0.0
    TrendUp := close[1]>TrendUp[1] ? max(Up,TrendUp[1]) : Up
    TrendDown = 0.0
    TrendDown := close[1]<TrendDown[1]? min(Dn,TrendDown[1]) : Dn
    Trend = 0.0
    Trend := close > TrendDown[1] ? 1: close< TrendUp[1]? -1: nz(Trend[1],1)
    Tsl = Trend==1? TrendUp: TrendDown

    Tsl

st_tsl = f_supertrend(Factor, Pd)

///////////////////////////////////////////////////////////////////////////////
///////////////////////////////////////////////////////////////////////////////
////////////////////////// MULTI TIMEFRAMES CALCS /////////////////////////////
///////////////////////////////////////////////////////////////////////////////
///////////////////////////////////////////////////////////////////////////////


f_securitys(_ticker, _source)=>

    daily = security(_ticker, 'D', _source[1], lookahead=true)
    weekly = security(_ticker, 'W', _source[1], lookahead=true)
    montly = security(_ticker, 'M', _source[1], lookahead=true)
    quarterly = security(_ticker, '3M', _source[1], lookahead=true)
    yearly = security(_ticker, '12M', _source[1], lookahead=true)

    [daily, weekly, montly, quarterly, yearly]


[st_daily, st_weekly, st_monthly, st_quarterly, st_yearly] = f_securitys(syminfo.tickerid, st_tsl)

lapos_x = timenow + round(change(time)*50)
lapos_y = close

down_arrows_text = "▼" + " " + "▼" + " " + "▼" + " " + "▼" + " " + "▼" + " " + "▼" + " " + "▼" + "\n"

// Drawing function designed by RicardoSantos.
f_draw_infopanel(_x, _y, _color, _line, _text)=>
    _rep_text = ""
    for _l = 0 to _line
        _rep_text := _rep_text + "\n"
    _rep_text := _rep_text + _text

    var label _la = na
    label.delete(_la)
    _la := label.new(x=_x, y=_y, text=_rep_text, xloc=xloc.bar_time, yloc=yloc.price,
     color=#C1CADE,  textcolor=_color, size=size.normal)

// Using the JustUncleL reverse order trick
f_draw_infopanel(lapos_x, lapos_y, color.olive,                 12, "╚═══════════════════════╝")
f_draw_infopanel(lapos_x, lapos_y, color.new(color.red, 20),    10,  "Yearly : " + tostring(round(st_yearly)))
f_draw_infopanel(lapos_x, lapos_y, color.new(color.purple, 20), 8,  "Quarterly : " + tostring(round(st_quarterly)))
f_draw_infopanel(lapos_x, lapos_y, color.new(color.green, 20),  6,  "Monthly : " + tostring(round(st_monthly)))
f_draw_infopanel(lapos_x, lapos_y, color.new(color.blue, 20),   4,  "Weekly : " +  tostring(round(st_weekly)))
f_draw_infopanel(lapos_x, lapos_y, color.new(color.green, 20),  2,  "Daily : " +  tostring(round(st_daily)))
f_draw_infopanel(lapos_x, lapos_y, color.olive,                 0,  "╔═════ Supertrend (" + tostring(Factor) + "," + tostring(Pd) + ") ═════╗")

IS_DAILY = TF == "daily"
IS_WEEKLY = TF == "weekly"
IS_MONTHLY = TF == "monthly"
IS_QUARTERLY = TF == "quarterly"
IS_YEARLY = TF == "yearly"

// select right supertrend
st_tsl_TF = iff(IS_DAILY, st_daily,
 iff(IS_WEEKLY, st_weekly,
 iff(IS_MONTHLY, st_monthly,
 iff(IS_QUARTERLY, st_quarterly,
 iff(IS_YEARLY, st_yearly, st_daily)))))


// hard exit
sma_fast = sma(close, fastLength)
sma_slow = sma(close, slowLength)
long_exit     = crossunder(sma_fast,sma_slow)
short_exit    = crossover(sma_fast,sma_slow)

// MA Cross
curr = 0 - barssince(long_exit) + barssince(short_exit)
cross_buy = curr < 0 ?  1 : 0
cross_sell = curr > 0 ? 1  : 0

bull = close >= st_tsl_TF and cross_buy
bear = close <= st_tsl_TF and cross_sell
entry_price = valuewhen(bull or bear, close, 0)

plot(sma_fast, "SMA fastLength", color=color.aqua, linewidth=2)
plot(sma_slow, "SMA slowLength", color=color.purple, linewidth=2)
plotshape(crossover(sma_fast,sma_slow), color=color.aqua, style=shape.circle, size=size.small)
plotshape(crossunder(sma_fast,sma_slow), color=color.purple, style=shape.circle, size=size.small)

// Plot the ST
linecolor = close >= st_tsl_TF ? color.green : color.red
plot(st_tsl_TF, color = linecolor , linewidth = 4,title = "SuperTrend", transp=0)

// Strategy entries/exits
if isLong
    strategy.entry("Long", 1, when=bull)
    strategy.close("Long", when=long_exit)

if isShort
    strategy.entry("Short", 0,  when=bear)
    strategy.close("Short", when=short_exit )
- Chiến lược Uptrend và Index Oversold Swing Trading System
- Chiến lược giao dịch xu hướng định lượng sử dụng hồi quy đa thức
- Combo Backtest 123 Reversal & Relative Volatility Index
- Chiến lược giao dịch SMA-3
- Chiến lược giao dịch tự động Bollinger Band
- Chiến lược giao dịch chéo Genesis
- Chiến lược Gunbot Bands
- Chiến lược giao dịch cặp
- Chiến lược mở với mục tiêu lợi nhuận năng động
- Nén Động lực trên Chiến lược đảo ngược
- Hệ thống đảo ngược
- Chiến lược EMA Zero Lag thích nghi
- Đám mây ICHIMOKU của BV - Tất cả tín hiệu
- Chiến lược chỉ số sức mạnh tương đối
- Bollinger Bands + EMA 9
- Chiến lược EMA20 đơn giản + Stochastic
- NTPCclient UDP && Exchange Server chậm trễ
- VWMA + SMA Bollinger Bands + Chiến lược RSI: Phân tích mối tương quan giá và khối lượng
- EMA200 và Chiến lược RSI Stochastic
- Trade05-K line hỗ trợ kháng cự + ATR stop