Chiến lược giao cắt EMA ba

Tổng quan
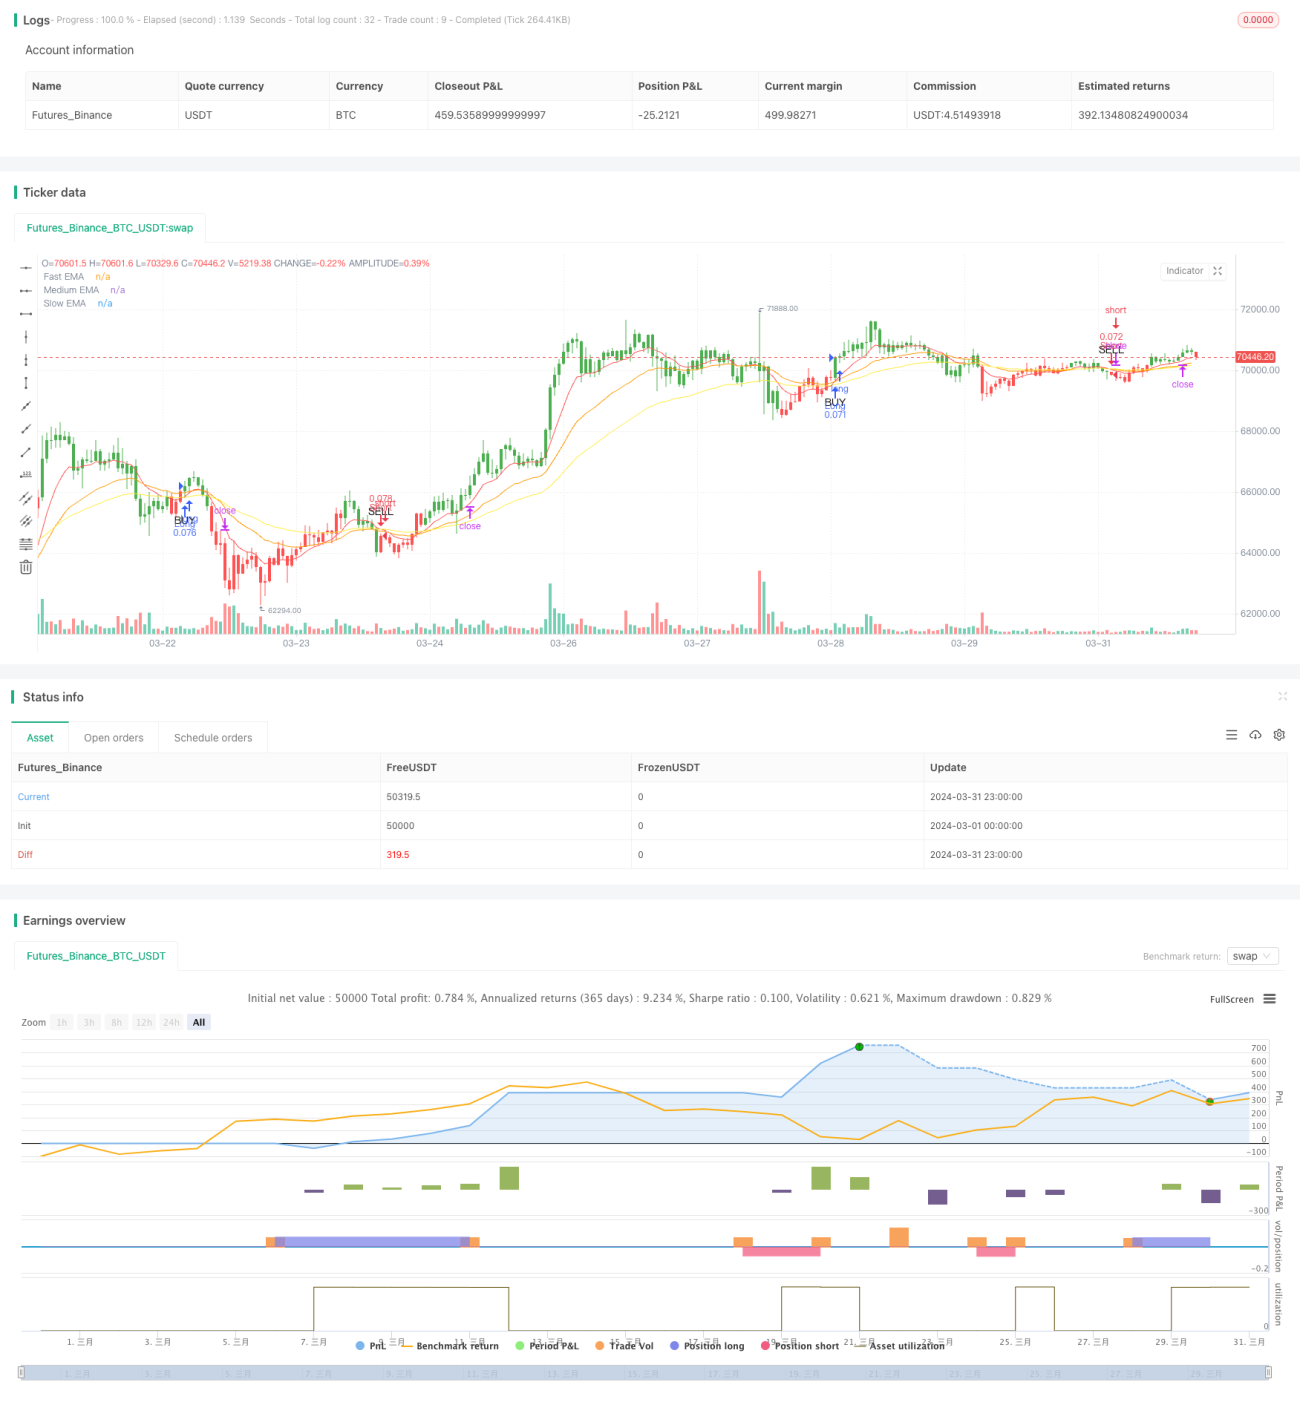
Chiến lược giao dịch EMA ba lần là một chiến lược giao dịch dựa trên tín hiệu giao dịch trung bình di chuyển chỉ số (EMA) của ba chu kỳ khác nhau. Chiến lược này sử dụng EMA nhanh (EMA 10) EMA trung bình (EMA 25) và EMA chậm (EMA 50) để nắm bắt xu hướng thị trường, đồng thời sử dụng chiều cao sóng thực trung bình (ATR) để thiết lập mức dừng và dừng để thích ứng với các tình trạng biến động thị trường khác nhau.
Nguyên tắc chiến lược
- Tính toán EMA của ba chu kỳ khác nhau: nhanh (khoảng 10), trung bình (khoảng 25) và chậm (khoảng 50).
- Khi EMA nhanh đi qua EMA chậm từ trên xuống, và EMA tốc độ trung bình ở trên EMA chậm, tạo ra tín hiệu chéo lưỡi lê.
- Một tín hiệu chéo giảm được tạo ra khi EMA nhanh đi từ trên xuống qua EMA chậm và EMA trung bình ở dưới EMA chậm.
- ATR được sử dụng để tính toán mức dừng động và dừng động, với thiết lập dừng 3 lần so với ATR và 6 lần so với ATR.
- Khi thấy tín hiệu giao thoa, hãy đặt nhiều hơn, đặt lệnh dừng lỗ và dừng.
- Khi có tín hiệu đợt giảm giá, hãy thực hiện lệnh shorting, đặt lệnh dừng lỗ và dừng chân.
Lợi thế chiến lược
- Chiến lược giao chéo EMA ba có thể lọc hiệu quả tiếng ồn thị trường và tập trung vào việc nắm bắt các xu hướng chính.
- Bằng cách sử dụng các EMA khác nhau, chiến lược này có thể phản ứng nhanh hơn với sự thay đổi giá, đồng thời đảm bảo tín hiệu được hỗ trợ bởi xu hướng trung hạn và dài hạn.
- Sử dụng ATR để điều chỉnh động mức dừng lỗ và dừng để chiến lược có thể thích ứng với các tình trạng biến động thị trường khác nhau, nâng cao hiệu quả quản lý rủi ro.
Rủi ro chiến lược
- Trong thị trường chấn động hoặc biến động cao, chiến lược này có thể tạo ra tín hiệu sai, dẫn đến giao dịch thường xuyên và tổn thất tiềm ẩn.
- Hiệu suất của chiến lược phụ thuộc rất nhiều vào lựa chọn của chu kỳ EMA, thiết lập tham số không phù hợp có thể dẫn đến giảm chất lượng tín hiệu.
- Chỉ dựa vào tín hiệu giao chéo trung bình di chuyển có thể không cung cấp phân tích thị trường toàn diện và cần được sử dụng kết hợp với các chỉ số kỹ thuật khác để xác nhận xu hướng và tín hiệu.
Hướng tối ưu hóa chiến lược
- Cân nhắc giới thiệu các chỉ số kỹ thuật khác, chẳng hạn như chỉ số tương đối mạnh (RSI) hoặc chỉ số ngẫu nhiên (Stochastic) để xác nhận hiệu quả của xu hướng và tín hiệu chéo.
- Thử nghiệm tối ưu hóa tham số cho các tình trạng thị trường và loại tài sản khác nhau để tìm ra kết hợp chu kỳ EMA và thiết lập nhân ATR tối ưu nhất.
- Tiếp tục kiểm soát rủi ro bằng cách đưa ra các biện pháp quản lý rủi ro, chẳng hạn như điều chỉnh kích thước vị trí dựa trên biến động của thị trường hoặc ngừng giao dịch trong điều kiện thị trường cụ thể.
Tóm tắt
Chiến lược giao chéo EMA ba cung cấp cho các nhà giao dịch một phương pháp hiệu quả để theo dõi xu hướng và quản lý rủi ro bằng cách sử dụng tín hiệu giao chéo trung bình di chuyển của chỉ số trong các chu kỳ khác nhau, kết hợp với các thiết lập dừng và dừng động động ATR. Mặc dù chiến lược này hoạt động tốt trong thị trường xu hướng, nhưng nó có thể gặp thách thức trong thị trường bất ổn. Do đó, các nhà giao dịch nên xem xét kết hợp nó với các công cụ phân tích kỹ thuật khác và tối ưu hóa các tham số cho các tình huống thị trường và loại tài sản khác nhau để tăng độ tin cậy và tiềm năng lợi nhuận của chiến lược.
/*backtest
start: 2024-03-01 00:00:00
end: 2024-03-31 23:59:59
period: 1h
basePeriod: 15m
exchanges: [{"eid":"Futures_Binance","currency":"BTC_USDT"}]
*/

//@version=5
strategy("Triple EMA Crossover Strategy", overlay=true, default_qty_type=strategy.percent_of_equity, default_qty_value=10)

// Input for EMA periods- 1