
Tổng quan
Chiến lược này là một hệ thống giao dịch dựa trên phân tích hình dạng của dải Brinh và dải Phong để nắm bắt cơ hội đảo ngược thị trường bằng cách phân tích biến động giá và các đặc điểm của dải Phong ở cấp độ đường mặt trời. Cốt lõi của chiến lược là kết hợp các kênh biến động của dải Brinh và các mối quan hệ tỷ lệ của đường bóng dưới với các thực thể trên dải Phong, để tìm kiếm tín hiệu đảo ngược tiềm năng khi giá chạm đến biên giới dải Phong. Hệ thống này hỗ trợ phân tích thời gian đa chu kỳ, có thể giao dịch trên các chu kỳ thời gian nhỏ hơn trong khi vẫn duy trì phân tích cấp độ Dải Phong.
Nguyên tắc chiến lược
Chiến lược sử dụng dải Brinh 20 chu kỳ làm chỉ số kỹ thuật chính, số nhân chênh lệch chuẩn là 2.0. Bằng cách tính toán tỷ lệ của đường bóng lên xuống của phác đồ so với thực thể, hệ thống sẽ phát ra tín hiệu giao dịch khi tỷ lệ vượt quá ngưỡng thiết lập (chính xác là 1.0) và giá chạm đến biên giới dải Brinh. Thời gian nhập cảnh có thể lựa chọn linh hoạt giá thu trong ngày, giá mở cửa ngày hôm sau, đỉnh hoặc thấp trong ngày.
Lợi thế chiến lược
- Phân tích đa chiều: kết hợp các chỉ số kỹ thuật và phân tích hình dạng giá, tăng độ tin cậy của tín hiệu.
- Cơ chế nhập cảnh linh hoạt: cung cấp nhiều lựa chọn thời gian nhập cảnh để phù hợp với phong cách giao dịch khác nhau.
- Quản lý rủi ro tốt: Kiểm soát rủi ro thông qua quy mô nắm giữ động và dừng lỗ tự động.
- Khả năng tương thích nhiều chu kỳ thời gian: Có thể thực hiện giao dịch trong một chu kỳ thời gian nhỏ hơn trong khi vẫn duy trì phân tích đường ngày.
- Tự động hóa cao: Tự động hóa từ nhận dạng tín hiệu đến quản lý vị trí
Rủi ro chiến lược
- Rủi ro biến động thị trường: Có thể tạo ra tín hiệu sai trong thị trường biến động mạnh.
- Rủi ro bị trì hoãn: Có thể không phản ứng kịp thời trong thị trường nhanh vì sử dụng dữ liệu đường nắng.
- Tính nhạy cảm của tham số: Lựa chọn các tham số Brin và giá trị giảm của tỷ lệ đường bóng ảnh hưởng đáng kể đến hiệu suất của chiến lược.
- Rủi ro về tính thanh khoản: Có thể khó giao dịch theo giá dự kiến trong thị trường ít thanh khoản hơn.
Hướng tối ưu hóa chiến lược
- Tiến hành phân tích khối lượng giao dịch: kết hợp dữ liệu khối lượng giao dịch để xác minh tính hiệu quả của sự đảo ngược giá.
- Thêm lọc môi trường thị trường: Thêm chỉ số cường độ xu hướng để lọc môi trường thị trường bất lợi.
- Các tham số tối ưu hóa tự thích ứng: Điều chỉnh các tham số và tỷ lệ đường bóng của Brin theo biến động của thị trường.
- Cải thiện kiểm soát rủi ro: tăng kiểm soát rút tiền và giám sát đường cong quyền lợi.
- Tăng cường tín hiệu xác nhận: giới thiệu các chỉ số kỹ thuật khác như là công cụ xác nhận phụ trợ.
Tóm tắt
Đây là một hệ thống giao dịch hoàn chỉnh kết hợp phân tích Brin và Photon để nắm bắt cơ hội đảo ngược thị trường thông qua phân tích đa chiều. Ưu điểm của chiến lược là khung phân tích toàn diện và hệ thống quản lý rủi ro tốt, nhưng cũng cần chú ý đến tác động của môi trường thị trường và lựa chọn tham số đối với hiệu suất chiến lược.
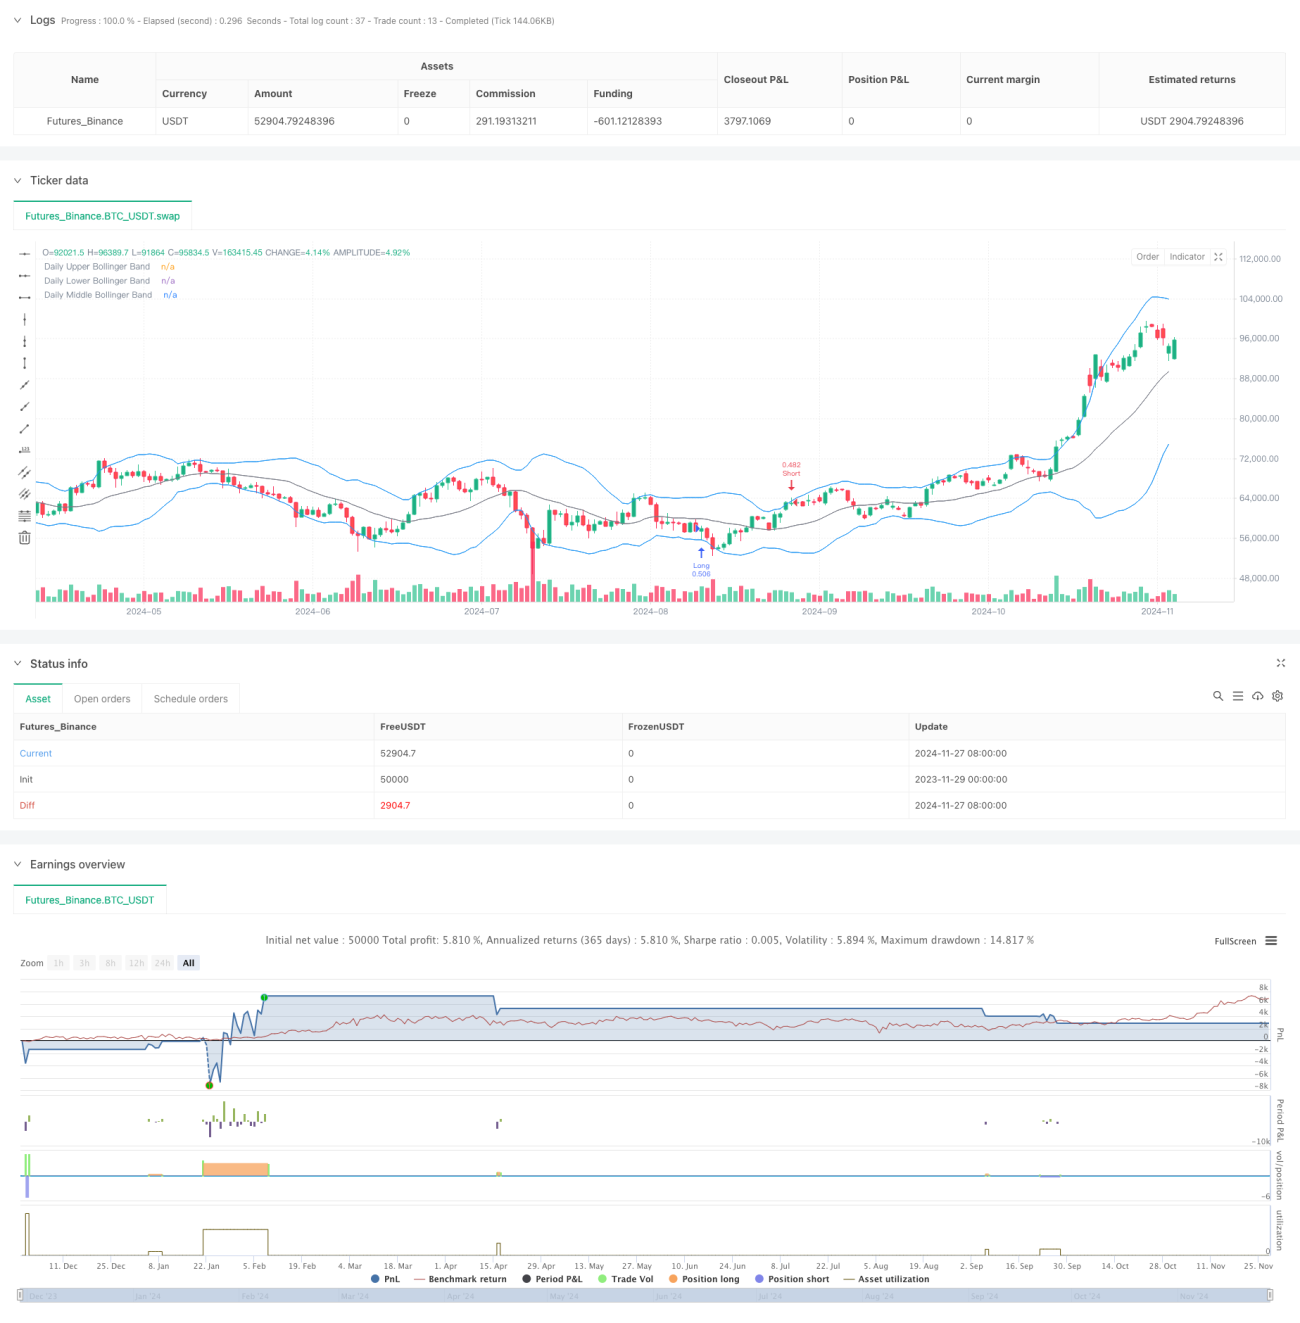
/*backtest
start: 2023-11-29 00:00:00
end: 2024-11-28 00:00:00
period: 1d
basePeriod: 1d
exchanges: [{"eid":"Futures_Binance","currency":"BTC_USDT"}]
*/

//@version=5
strategy("Trade Entry Detector, based on Wick to Body Ratio when price tests Bollinger Bands", overlay=true, default_qty_type=strategy.fixed)

// Input for primary analysis time frame- 1