
Tổng quan
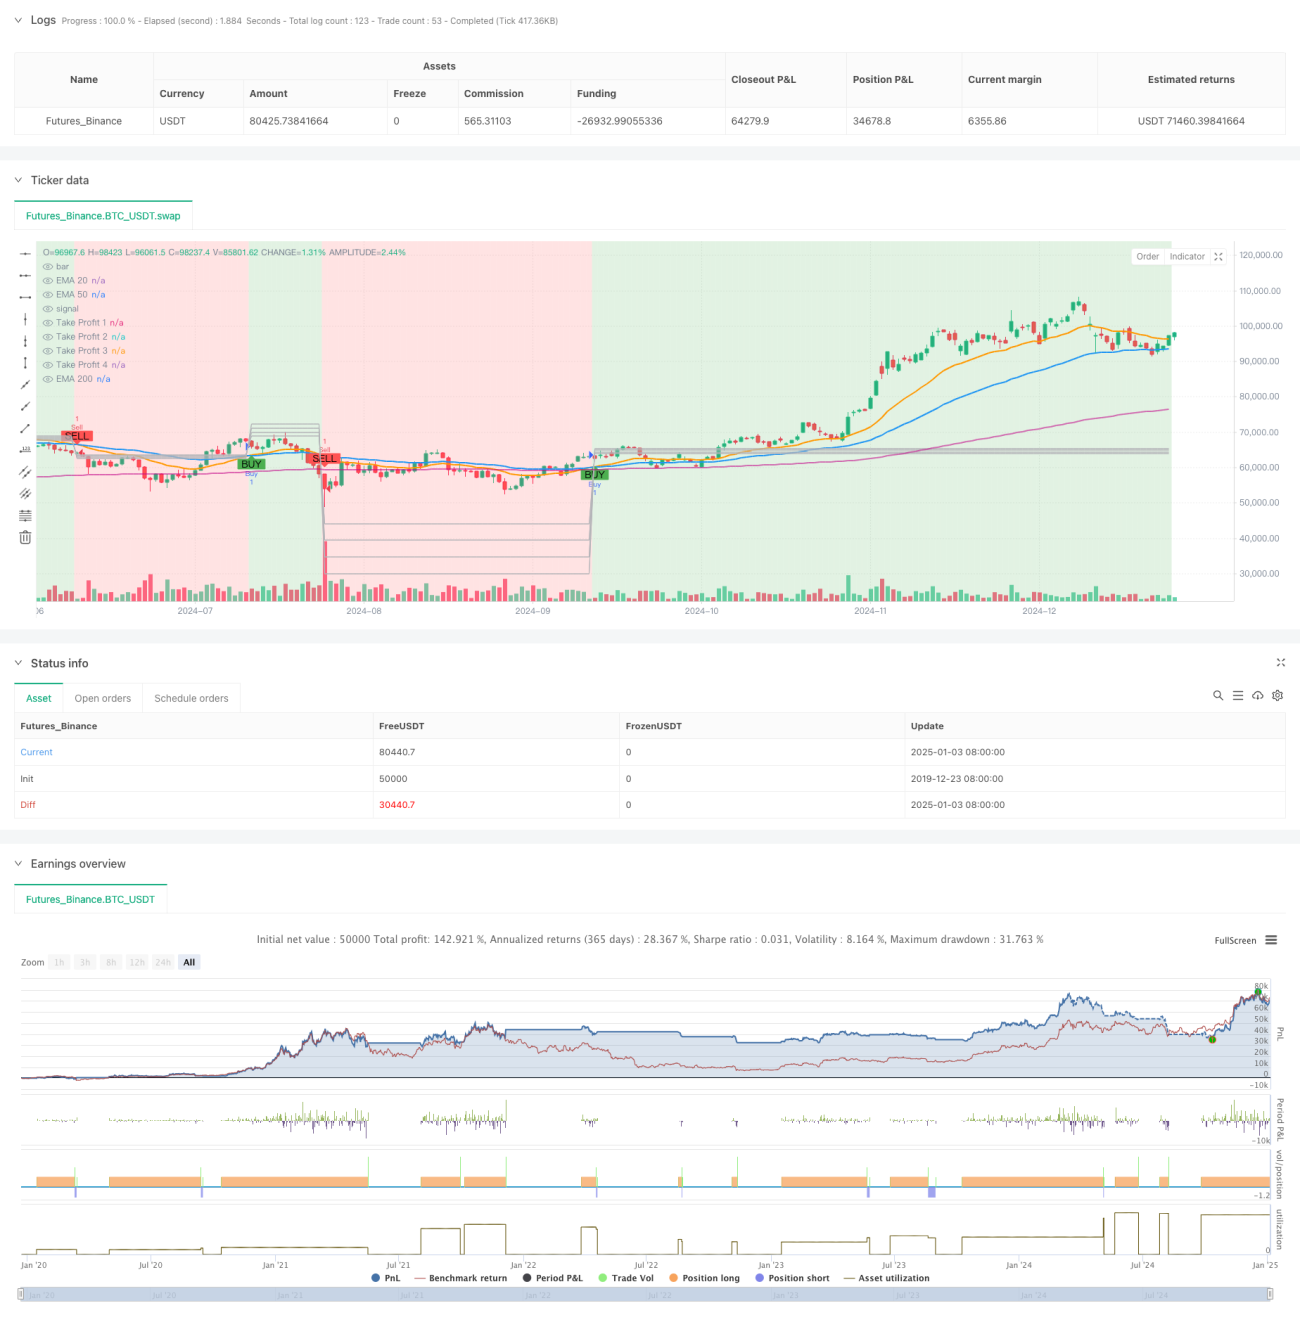
Chiến lược này là một hệ thống giao dịch dựa trên đường trung bình động hàm mũ (EMA), chủ yếu sử dụng sự giao cắt của EMA20 và EMA50 để nhận diện sự thay đổi xu hướng thị trường. Chiến lược thiết kế các mức chốt lời đa cấp động, kết hợp với cơ chế cắt lỗ để kiểm soát rủi ro. Hệ thống hiển thị trực quan hướng của xu hướng thị trường thông qua sự thay đổi màu nền, giúp nhà giao dịch nắm bắt diễn biến thị trường tốt hơn.
Nguyên lý chiến lược
Logic cốt lõi của chiến lược dựa trên các khía cạnh sau:
- Sử dụng sự giao cắt của EMA20 và EMA50 để xác định hướng xu hướng: Khi EMA20 cắt lên trên EMA50 phát sinh tín hiệu mua, khi cắt xuống dưới phát sinh tín hiệu bán
- Dựa trên phạm vi biến động của nến trước đó để thiết lập động bốn mục tiêu chốt lời:
- TP1 được đặt ở mức 0,5 lần phạm vi biến động
- TP2 được đặt ở mức 1,0 lần phạm vi biến động
- TP3 được đặt ở mức 1,5 lần phạm vi biến động
- TP4 được đặt ở mức 2,0 lần phạm vi biến động
- Đặt điểm cắt lỗ 3% để kiểm soát rủi ro
- Hiển thị hướng xu hướng thông qua sự thay đổi màu nền của nến: Xu hướng tăng hiển thị màu xanh lá, xu hướng giảm hiển thị màu đỏ
Lợi thế của chiến lược
- Thiết lập điểm chốt lời động: Tự động điều chỉnh mục tiêu chốt lời dựa trên biến động thị trường thực tế, khả năng thích ứng cao
- Cơ chế chốt lời đa cấp: Thông qua việc thiết lập nhiều điểm chốt lời, vừa đảm bảo khóa lợi nhuận, vừa cho xu hướng không gian phát triển đầy đủ
- Hiệu ứng trực quan nổi bật: Hướng xu hướng được hiển thị trực quan qua màu nền, thuận tiện để đánh giá nhanh trạng thái thị trường
- Kiểm soát rủi ro hoàn chỉnh: Thiết lập điểm cắt lỗ cố định, kiểm soát hiệu quả mức thua lỗ tối đa cho mỗi giao dịch
- Tham số linh hoạt có thể điều chỉnh: Nhà giao dịch có thể điều chỉnh hệ số nhân điểm chốt lời và phần trăm cắt lỗ tùy theo các điều kiện thị trường khác nhau
Rủi ro của chiến lược
- Độ trễ của đường trung bình: Bản thân EMA có độ trễ nhất định, có thể dẫn đến thời điểm phát sinh tín hiệu bị chậm
- Rủi ro thị trường dao động: Trong thị trường đi ngang có thể tạo ra nhiều tín hiệu giả
- Cắt lỗ cố định: Mức cắt lỗ theo phần trăm cố định có thể không phù hợp với mọi môi trường thị trường
- Khoảng cách điểm chốt lời: Trong thị trường biến động mạnh, khoảng cách các điểm chốt lời có thể quá lớn hoặc quá nhỏ
Hướng tối ưu hóa chiến lược
- Đưa vào các chỉ báo phụ trợ: Có thể thêm các chỉ báo như RSI hoặc MACD làm xác nhận tín hiệu giao cắt
- Tối ưu cơ chế cắt lỗ: Có thể cân nhắc sử dụng ATR để thiết lập khoảng cách cắt lỗ động
- Thêm bộ lọc thời gian: Thêm khung thời gian giao dịch, tránh những giai đoạn biến động mạnh
- Hoàn thiện quản lý vị thế: Điều chỉnh động quy mô nắm giữ dựa trên biến động thị trường
- Tối ưu xác nhận tín hiệu: Có thể thêm các chỉ báo như khối lượng làm điều kiện xác nhận phụ trợ
Tổng kết
Đây là một chiến lược bám xu hướng có cấu trúc hoàn chỉnh, logic rõ ràng. Bắt xu hướng thông qua giao cắt đường trung bình, quản lý lợi nhuận bằng các điểm chốt lời động, kết hợp cắt lỗ kiểm soát rủi ro. Thiết kế trực quan của chiến lược hiệu quả rõ ràng, các tham số linh hoạt có thể điều chỉnh. Mặc dù tồn tại vấn đề độ trễ vốn có của đường trung bình, nhưng thông qua tối ưu hóa và hoàn thiện có thể nâng cao hơn nữa tính ổn định và khả năng sinh lời của chiến lược.
- 1