Tổng quan
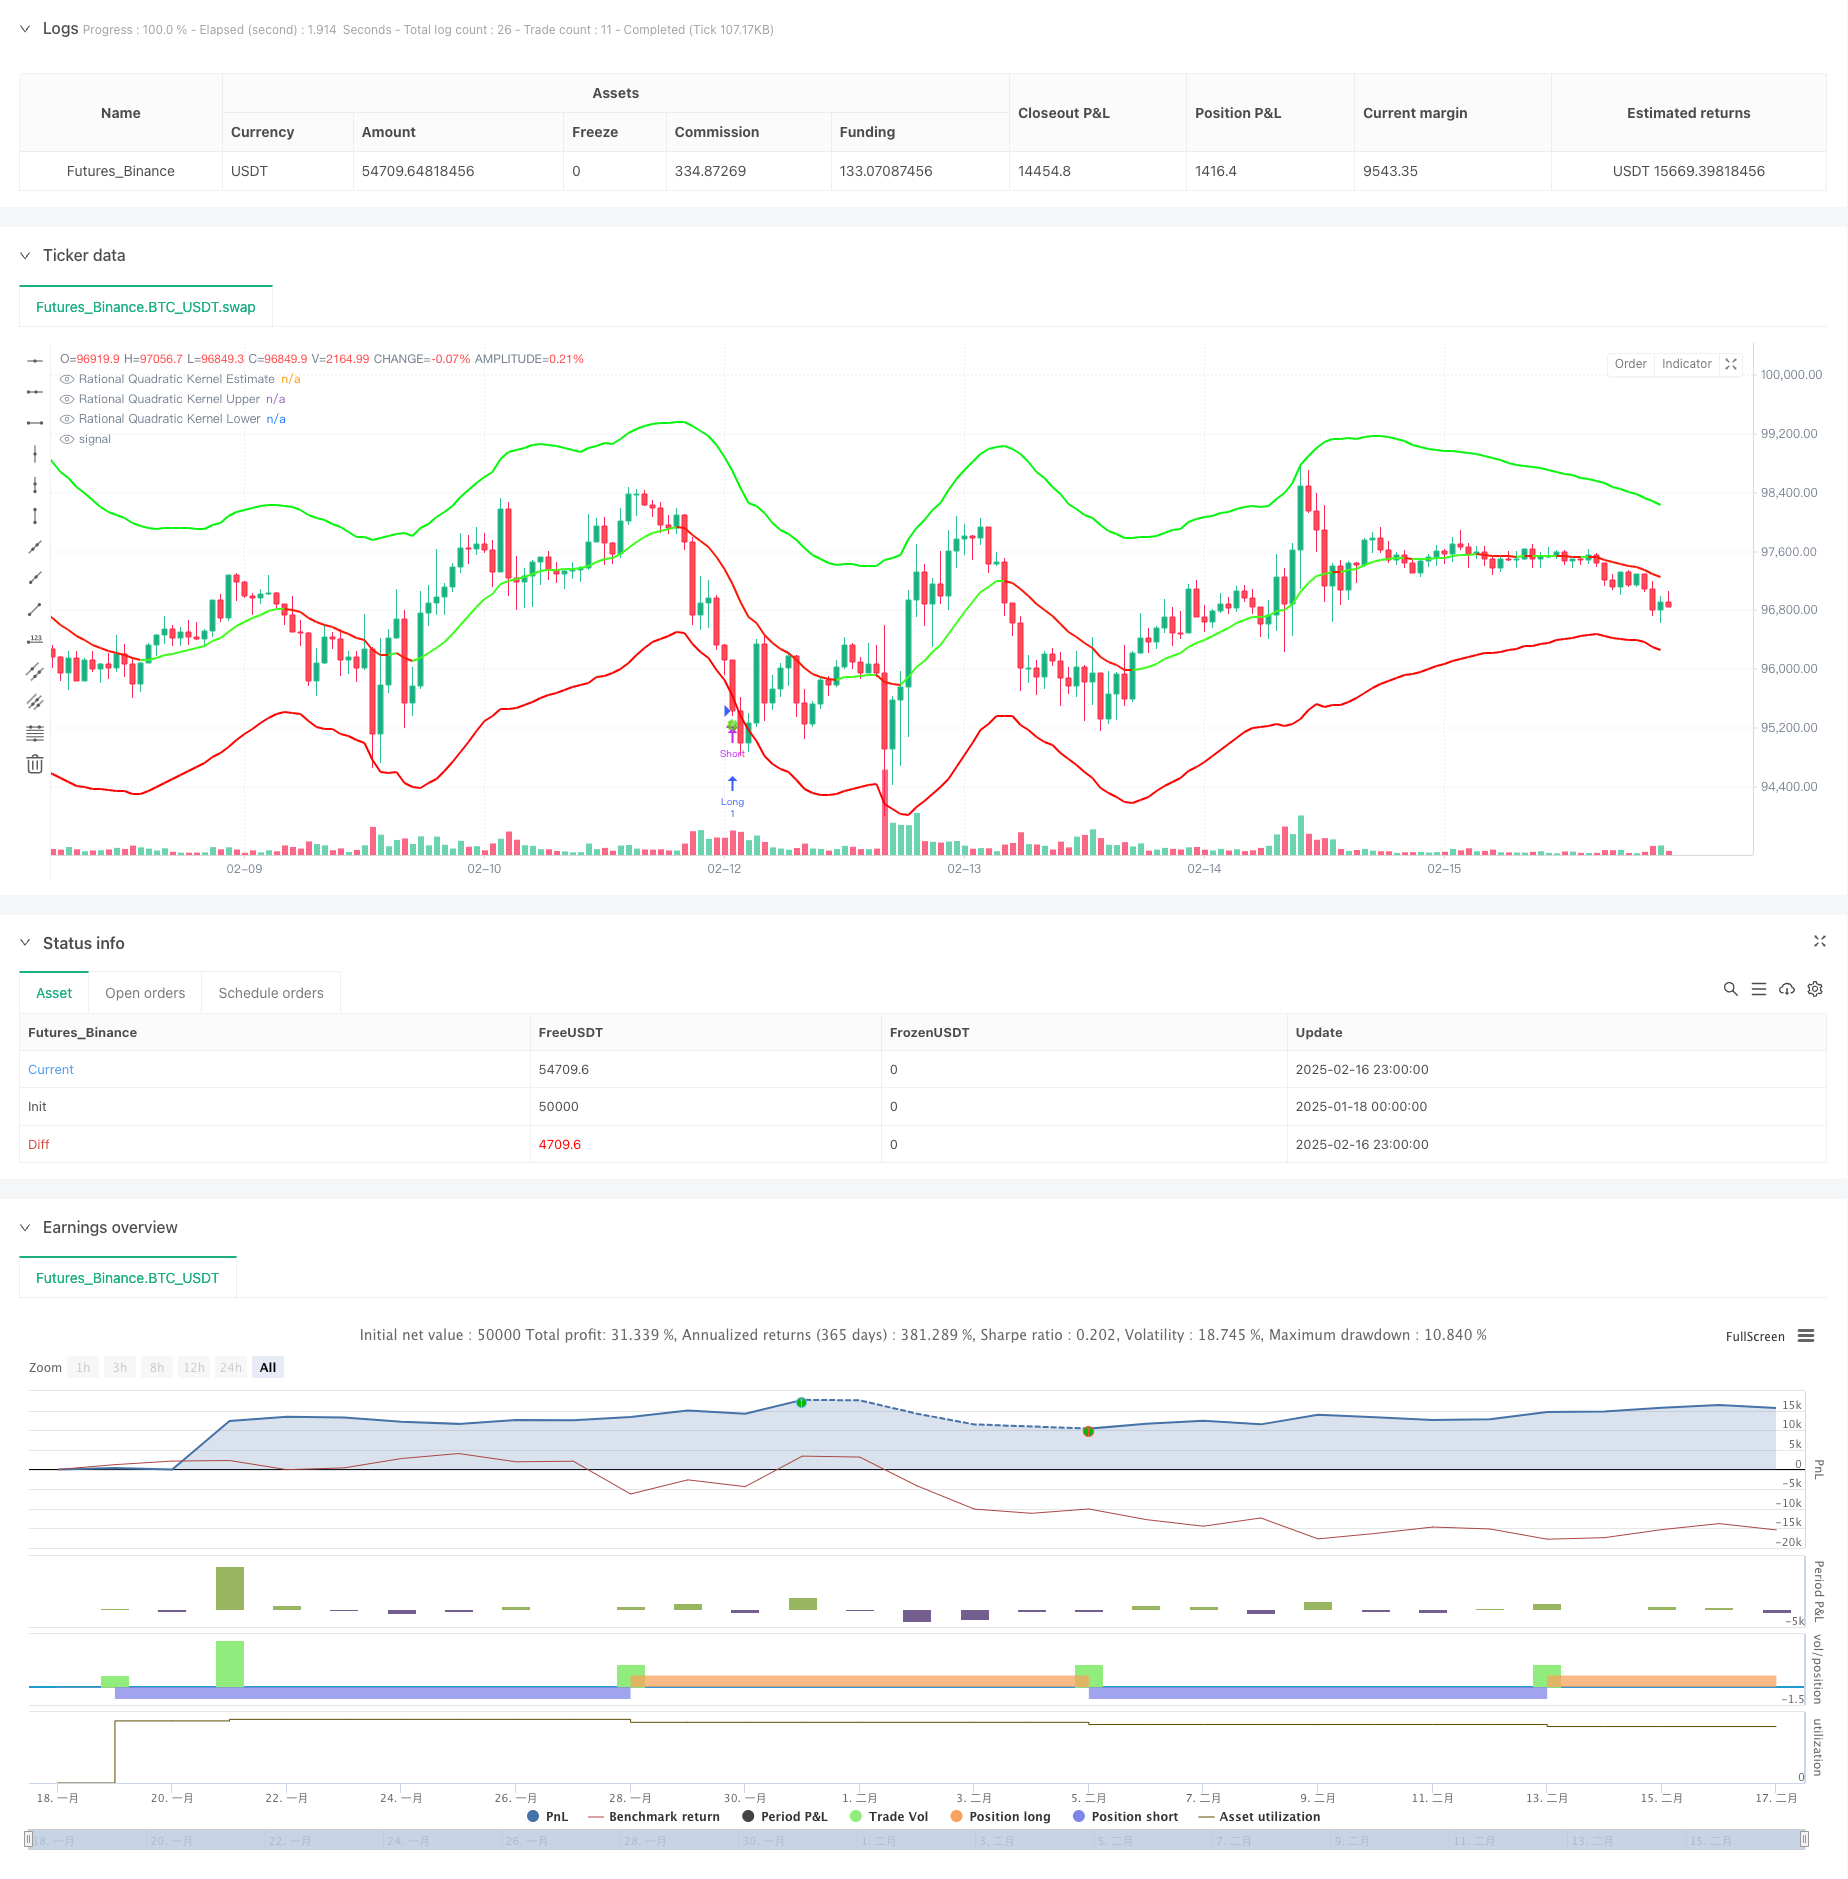
Chiến lược này là một hệ thống theo dõi xu hướng tự điều chỉnh kết hợp Nadaraya-Watson Nuclear Regression và ATR Dynamic Band. Nó dự đoán xu hướng giá thông qua hàm lõi thứ hai hợp lý và sử dụng hỗ trợ động và kháng cự dựa trên ATR để xác định cơ hội giao dịch. Hệ thống thực hiện mô hình chính xác của thị trường thông qua cửa sổ lùi có thể cấu hình và tham số trọng lượng.
Nguyên tắc chiến lược
Cốt lõi của chiến lược là sự hồi quy không tham số dựa trên phương pháp Nadaraya-Watson, sử dụng hàm lõi thứ hai hợp lý để xử lý trật tự giá một cách mượt mà. Sự hồi quy bắt đầu tính từ thanh bắt đầu được đặt, kiểm soát mức độ phù hợp thông qua cửa sổ lookback ((h) và trọng lượng tương đối (® hai tham số quan trọng. Đồng thời kết hợp với chỉ số ATR để xây dựng các dải tần động, trên và dưới các dải quay trở lại ước tính giá trị tăng và giảm ATR lần lượt.
Lợi thế chiến lược
- Phương pháp hồi quy hạt nhân có nền tảng toán học tốt, có thể nắm bắt xu hướng giá một cách hiệu quả mà không quá phù hợp
- Dải sóng động tự điều chỉnh theo biến động của thị trường, cung cấp điểm kháng cự hỗ trợ hợp lý hơn
- Các tham số có thể được cấu hình mạnh mẽ, có thể điều chỉnh linh hoạt theo các đặc điểm thị trường khác nhau
- Cơ chế nhận dạng xu hướng linh hoạt, có thể chọn chế độ trơn tru hoặc nhạy cảm
- Hiệu ứng trực quan, tín hiệu giao dịch rõ ràng
Rủi ro chiến lược
- Chọn tham số không đúng có thể dẫn đến quá phù hợp hoặc trễ
- Có thể có quá nhiều tín hiệu giao dịch trong thị trường bất ổn
- Thiết lập ATR không hợp lý có thể gây ra lỗ hổng quá rộng hoặc quá hẹp
- Có thể có tín hiệu sai trong thời gian chuyển hướng Khuyến nghị sử dụng các tham số tối ưu hóa theo lịch sử và kết hợp với các chỉ số khác để xác nhận hỗ trợ.
Hướng tối ưu hóa chiến lược
- Tiến hành chỉ số giao dịch để xác nhận xu hướng
- Phát triển cơ chế tối ưu hóa tham số thích ứng
- Tăng cường độ xu hướng bộ lọc giảm tín hiệu giả thị trường
- Tối ưu hóa hệ thống dừng lỗ để tăng tỷ lệ lợi nhuận
- Xem xét việc đưa vào phân loại môi trường thị trường, sử dụng các tham số khác nhau trong các thị trường khác nhau
Tóm tắt
Chiến lược này được xây dựng bằng cách kết hợp các phương pháp học thống kê với phân tích kỹ thuật để xây dựng một hệ thống giao dịch có nền tảng lý thuyết vững chắc và thực tế. Tính năng thích ứng và khả năng cấu hình của nó cho phép nó thích ứng với các môi trường thị trường khác nhau, nhưng cần chú ý đến việc tối ưu hóa tham số và kiểm soát rủi ro khi sử dụng.
/*backtest
start: 2025-01-18 00:00:00
end: 2025-02-17 00:00:00
period: 1h
basePeriod: 1h
exchanges: [{"eid":"Futures_Binance","currency":"BTC_USDT"}]
*/

// This source code is subject to the terms of the Mozilla Public License 2.0 at https://mozilla.org/MPL/2.0/
// © Lupown

//@version=5
strategy("Nadaraya-Watson non repainting Strategy", overlay=true)  // PARAMETER timeframe ODSTRÁNENÝ

//--------------------------------------------------------------------------------
// INPUTS
//--------------------------------------------------------------------------------
src = input.source(close, 'Source')
h   = input.float(8., 'Lookback Window', minval=3., tooltip='The number of bars used for the estimation. This is a sliding value that represents the most recent historical bars. Recommended range: 3-50')
r   = input.float(8., 'Relative Weighting', step=0.25, tooltip='Relative weighting of time frames. As this value approaches zero, the longer time frames will exert more influence on the estimation. As this value approaches infinity, the behavior of the Rational Quadratic Kernel will become identical to the Gaussian kernel. Recommended range: 0.25-25')
x_0 = input.int(25, "Start Regression at Bar", tooltip='Bar index on which to start regression. The first bars of a chart are often highly volatile, and omission of these initial bars often leads to a better overall fit. Recommended range: 5-25')
showMiddle    = input.bool(true, "Show middle band")
smoothColors  = input.bool(false, "Smooth Colors", tooltip="Uses a crossover based mechanism to determine colors. This often results in less color transitions overall.", inline='1', group='Colors')
lag           = input.int(2, "Lag", tooltip="Lag for crossover detection. Lower values result in earlier crossovers. Recommended range: 1-2", inline='1', group='Colors')

lenjeje = input.int(32, "ATR Period",    tooltip="Period to calculate upper and lower band", group='Bands')
coef    = input.float(2.7, "Multiplier", tooltip="Multiplier to calculate upper and lower band", group='Bands')

//--------------------------------------------------------------------------------
// ARRAYS & VARIABLES
//--------------------------------------------------------------------------------
float y1 = 0.0
float y2 = 0.0
srcArray = array.new<float>(0)
array.push(srcArray, src)
size = array.size(srcArray)

//--------------------------------------------------------------------------------
// KERNEL REGRESSION FUNCTIONS
//--------------------------------------------------------------------------------
kernel_regression1(_src, _size, _h) =>
    float _currentWeight = 0.
    float _cumulativeWeight = 0.
    for i = 0 to _size + x_0
        y = _src[i]
        w = math.pow(1 + (math.pow(i, 2) / ((math.pow(_h, 2) * 2 * r))), -r)
        _currentWeight    += y * w
        _cumulativeWeight += w
    [_currentWeight, _cumulativeWeight]

[currentWeight1, cumulativeWeight1] = kernel_regression1(src, size, h)
yhat1 = currentWeight1 / cumulativeWeight1

[currentWeight2, cumulativeWeight2] = kernel_regression1(src, size, h - lag)
yhat2 = currentWeight2 / cumulativeWeight2

//--------------------------------------------------------------------------------
// TREND & COLOR DETECTION
//--------------------------------------------------------------------------------
// Rate-of-change-based
bool wasBearish   = yhat1[2] > yhat1[1]
bool wasBullish   = yhat1[2] < yhat1[1]
bool isBearish    = yhat1[1] > yhat1
bool isBullish    = yhat1[1] < yhat1
bool isBearishChg = isBearish  and wasBullish
bool isBullishChg = isBullish  and wasBearish

// Crossover-based (for "smooth" color changes)
bool isBullishCross  = ta.crossover(yhat2, yhat1)
bool isBearishCross  = ta.crossunder(yhat2, yhat1)
bool isBullishSmooth = yhat2 > yhat1
bool isBearishSmooth = yhat2 < yhat1

color c_bullish    = input.color(#3AFF17, 'Bullish Color', group='Colors')
color c_bearish    = input.color(#FD1707, 'Bearish Color', group='Colors')

color colorByCross = isBullishSmooth ? c_bullish : c_bearish
color colorByRate  = isBullish       ? c_bullish : c_bearish
color plotColor    = smoothColors ? colorByCross : colorByRate

// Middle Estimate
plot(showMiddle ? yhat1 : na, "Rational Quadratic Kernel Estimate", color=plotColor, linewidth=2)

//--------------------------------------------------------------------------------
// UPPER / LOWER BANDS
//--------------------------------------------------------------------------------
upperjeje = yhat1 + coef * ta.atr(lenjeje)
lowerjeje = yhat1 - coef * ta.atr(lenjeje)

plotUpper = plot(upperjeje, "Rational Quadratic Kernel Upper", color=color.rgb(0, 247, 8), linewidth=2)
plotLower = plot(lowerjeje, "Rational Quadratic Kernel Lower", color=color.rgb(255, 0, 0), linewidth=2)

//--------------------------------------------------------------------------------
// SYMBOLS & ALERTS
//--------------------------------------------------------------------------------
plotchar(ta.crossover(close, upperjeje),  char="🥀", location=location.abovebar, size=size.tiny)
plotchar(ta.crossunder(close, lowerjeje), char="🍀", location=location.belowbar, size=size.tiny)

// Alerts for Color Changes (estimator)
alertcondition(smoothColors ? isBearishCross : isBearishChg, title="Bearish Color Change", message="Nadaraya-Watson: {{ticker}} ({{interval}}) turned Bearish ▼")
alertcondition(smoothColors ? isBullishCross : isBullishChg, title="Bullish Color Change", message="Nadaraya-Watson: {{ticker}} ({{interval}}) turned Bullish ▲")

// Alerts when price crosses upper and lower band
alertcondition(ta.crossunder(close, lowerjeje), title="Price close under lower band", message="Nadaraya-Watson: {{ticker}} ({{interval}}) crossed under lower band 🍀")
alertcondition(ta.crossover(close, upperjeje),  title="Price close above upper band", message="Nadaraya-Watson: {{ticker}} ({{interval}}) Crossed above upper band 🥀")

//--------------------------------------------------------------------------------
// STRATEGY LOGIC (EXAMPLE)
//--------------------------------------------------------------------------------
if ta.crossunder(close, lowerjeje)
    // zatvoriť short
    strategy.close("Short")
    // otvoriť long
    strategy.entry("Long", strategy.long)

if ta.crossover(close, upperjeje)
    // zatvoriť long
    strategy.close("Long")
    // otvoriť short
    strategy.entry("Short", strategy.short)