
Tổng quan
Đây là một chiến lược giao dịch định lượng tần số cao dựa trên bản đồ nóng và phân tích xu hướng đa chu kỳ. Chiến lược này giúp nắm bắt thời gian tham gia thị trường chính xác bằng cách kết hợp các vùng kháng cự hỗ trợ bản đồ nóng, trung bình di chuyển theo chu kỳ và hàng tháng và hệ thống tín hiệu cảnh báo.
Nguyên tắc chiến lược
Chiến lược này dựa trên một số thành phần cốt lõi:
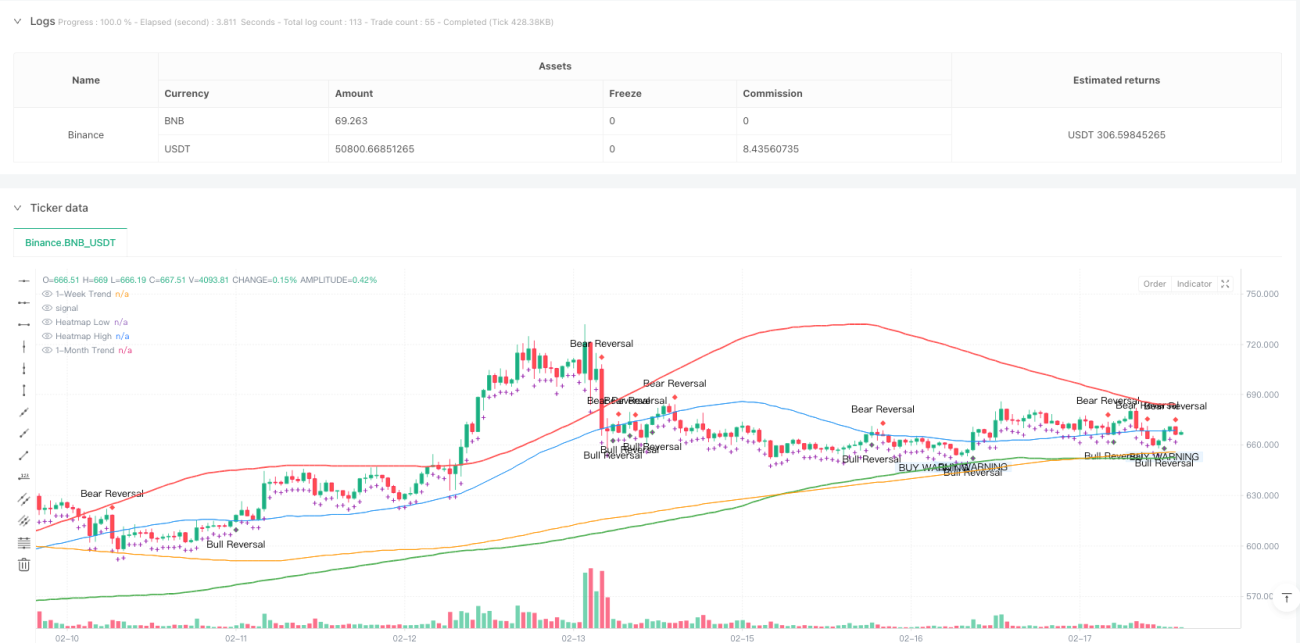
- Khu vực giao dịch biểu đồ nóng: Sử dụng tính toán trung bình di chuyển của giá cao nhất và giá thấp nhất để hỗ trợ điểm kháng cự, tạo ra biểu đồ nóng giao dịch.
- Xác định xu hướng đa chu kỳ: Sử dụng đường tròn và đường tròn để xác định xu hướng thị trường.
- Hệ thống tín hiệu cảnh báo trước: cung cấp cảnh báo trước khi tín hiệu giao dịch thực tế, giúp các nhà giao dịch chuẩn bị trước.
- Đường đi dự đoán xu hướng: hiển thị hướng di chuyển có thể của giá thông qua dấu chữ thập tím.
- Chỉ số đảo ngược của bò và gấu: hiển thị điểm đảo ngược xu hướng tiềm ẩn bằng dấu hiệu hình kim cương.
Lợi thế chiến lược
- Phân tích đa chiều: kết hợp các biểu đồ nóng, xu hướng và tín hiệu đảo ngược để cung cấp thông tin chi tiết về thị trường.
- Cơ chế cảnh báo trước: Cung cấp cảnh báo trước thông qua bong bóng cảnh báo trước, tránh ra quyết định vội vàng.
- Tính linh hoạt: Có thể hoạt động trong nhiều chu kỳ thời gian, thích ứng với phong cách giao dịch khác nhau.
- Hiệu ứng hình ảnh: Hệ thống chỉ số hình ảnh rõ ràng, giúp đưa ra quyết định nhanh chóng.
- Kiểm soát rủi ro: Giảm nguy cơ tín hiệu giả thông qua cơ chế xác nhận nhiều lần.
Rủi ro chiến lược
- Rủi ro biến động thị trường: có thể tạo ra tín hiệu giả trong thời gian biến động cao.
- Tính nhạy cảm của tham số: Sự lựa chọn của độ nhạy cảm của bản đồ nhiệt và chu kỳ trung bình di chuyển có ảnh hưởng lớn đến hiệu suất của chiến lược.
- Rủi ro bị trượt: Các giao dịch tần số cao có thể bị trượt lớn.
- Chi phí giao dịch: giao dịch thường xuyên có thể dẫn đến chi phí giao dịch cao hơn.
- Tùy thuộc vào môi trường thị trường: Chiến lược có thể không hiệu quả trong một số môi trường thị trường.
Hướng tối ưu hóa chiến lược
- Điều chỉnh tham số động: giới thiệu hệ thống tham số thích ứng, điều chỉnh độ nhạy của đồ thị nhiệt theo biến động của thị trường.
- Bộ lọc tín hiệu: Tăng lượng giao dịch và bộ lọc tỷ lệ dao động, giảm tín hiệu giả.
- Quản lý rủi ro: tham gia hệ thống quản lý mục tiêu dừng lỗ và lợi nhuận động.
- Nhận diện môi trường thị trường: Phát triển mô-đun nhận diện môi trường thị trường, tự động ngừng giao dịch trong môi trường thị trường không phù hợp.
- Tối ưu hóa học máy: giới thiệu thuật toán học máy để tối ưu hóa lựa chọn tham số và xác nhận tín hiệu.
Tóm tắt
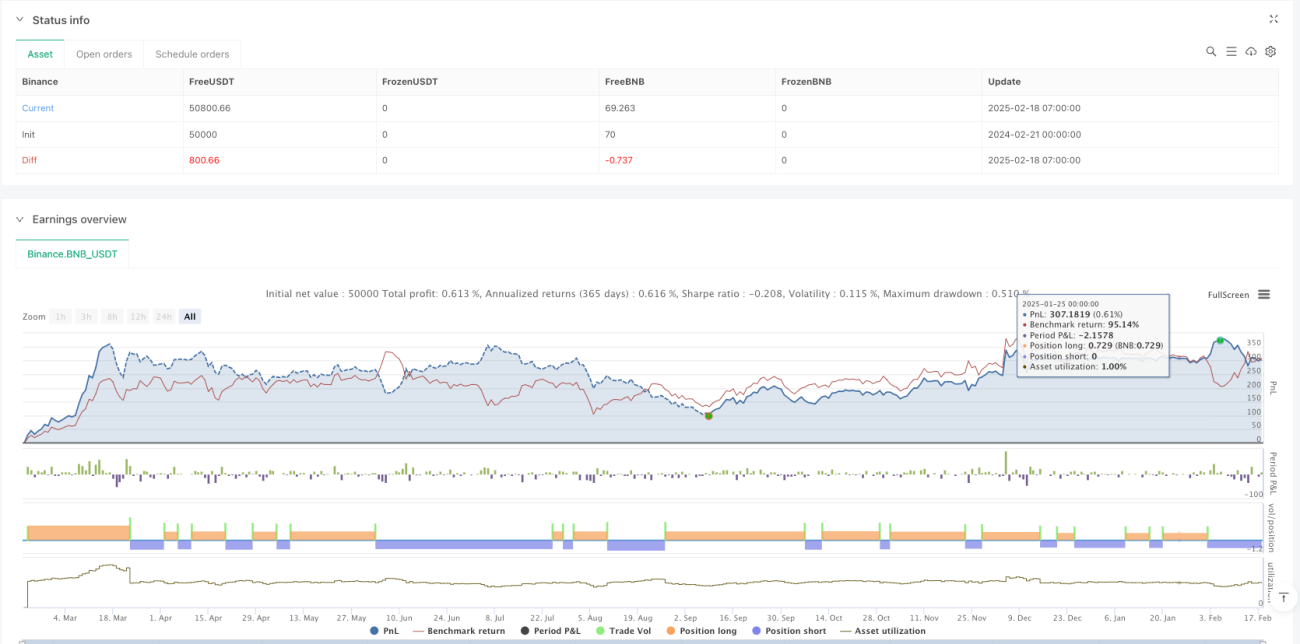
Chiến lược bắn tỉa biểu đồ nhiệt đa chu kỳ định lượng tần số cao là một hệ thống giao dịch tổng hợp kết hợp nhiều chỉ số kỹ thuật. Bằng cách kết hợp phân tích biểu đồ nhiệt, xác nhận xu hướng đa chu kỳ và cơ chế cảnh báo, nó cung cấp cho các nhà giao dịch một công cụ hỗ trợ quyết định đáng tin cậy. Thành công của chiến lược phụ thuộc vào cài đặt tham số chính xác và lựa chọn môi trường thị trường, nên được kiểm tra và tối ưu hóa đầy đủ trước khi giao dịch trực tiếp.
- 1