Chiến lược giao dịch kết hợp đường trung bình động kép nâng cao và siêu xu hướng

Tổng quan
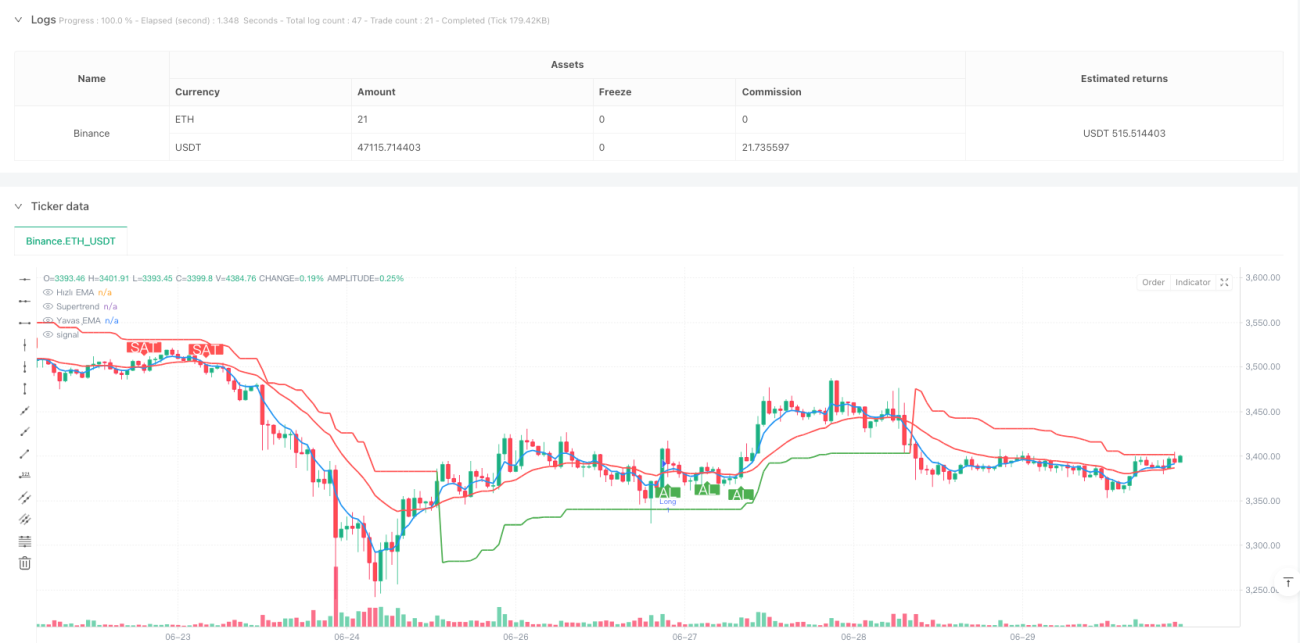
Đây là một chiến lược giao dịch theo dõi xu hướng kết hợp hệ thống hai đường cong ((EMA5 và EMA20) và chỉ số siêu xu hướng ((Supertrend)). Chiến lược này xác nhận hướng xu hướng bằng tín hiệu chéo giữa trung bình di chuyển nhanh và trung bình di chuyển chậm, kết hợp với chỉ số Supertrend, tạo thành một hệ thống giao dịch đáng tin cậy.
Nguyên tắc chiến lược
Lập luận cốt lõi của chiến lược dựa trên việc sử dụng kết hợp ba chỉ số kỹ thuật quan trọng:
- Chỉ số di chuyển nhanh (EMA5) được sử dụng để nắm bắt biến động giá trong thời gian ngắn
- Chỉ số chuyển động chậm (EMA20) được sử dụng để xác định hướng xu hướng trung hạn
- Chỉ số Supertrend dựa trên tính toán ATR (trung lượng sóng thực) để xác nhận xu hướng tổng thể
Các tín hiệu mua phải đáp ứng hai điều kiện:
- EMA5 đi lên qua EMA20
- Chỉ số Supertrend cho thấy xu hướng tăng
Các tín hiệu bán hàng phải đáp ứng:
- EMA5 đi xuống qua EMA20
- Chỉ số Supertrend cho thấy xu hướng giảm
Lợi thế chiến lược
- Cơ chế xác minh kép đã cải thiện đáng kể độ tin cậy của tín hiệu giao dịch
- Kết hợp lợi thế của theo dõi xu hướng và giao dịch động lực
- Hệ thống chỉ thị trực quan rõ ràng, bao gồm các dấu hiệu tín hiệu mua và bán và hiển thị đường xu hướng
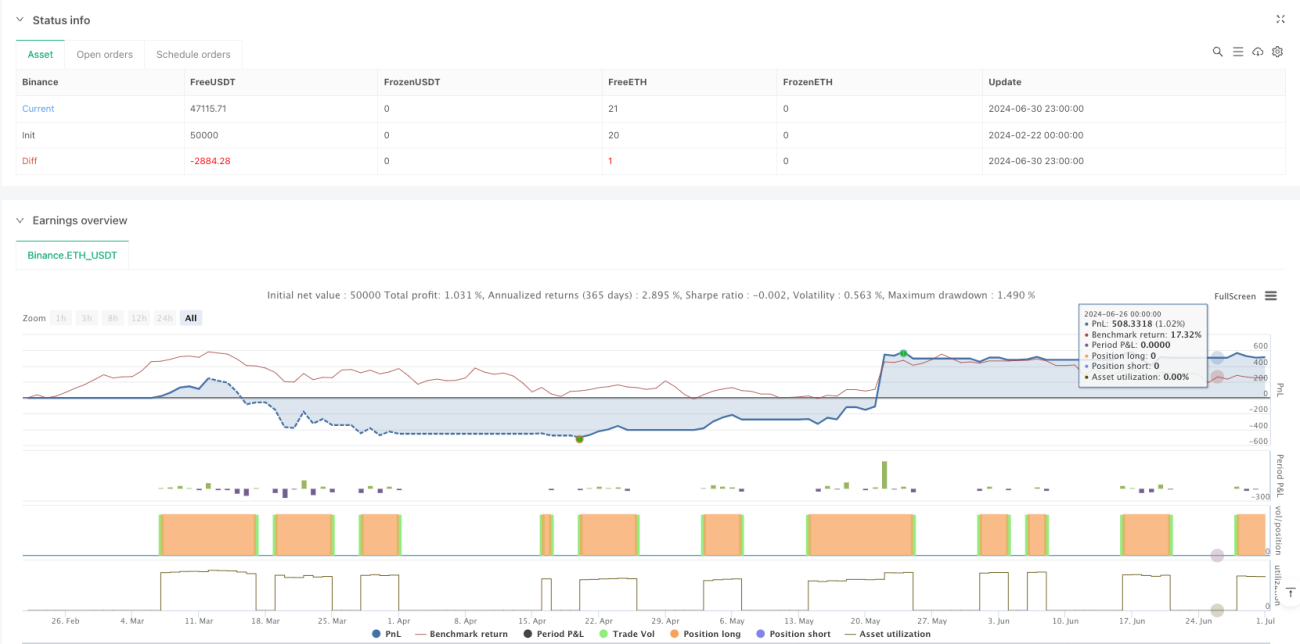
- Bảng thông tin về tình trạng thị trường trong thời gian thực
- Các tham số có thể được điều chỉnh linh hoạt theo các điều kiện thị trường khác nhau
- Thích hợp cho giao dịch xu hướng trung và dài hạn
Rủi ro chiến lược
- Có thể tạo ra các tín hiệu sai lệch thường xuyên trong thị trường phân tích ngang
- Một sự thoái lui lớn có thể xảy ra trong một sự đảo ngược nhanh chóng
- Các tham số cố định có thể không phù hợp với tất cả các môi trường thị trường
Giải pháp:
- Khuyến nghị sử dụng khung thời gian lớn hơn như đường ngày hoặc đường 4 giờ
- Thực hiện chiến lược dừng lỗ nghiêm ngặt
- Các tham số điều chỉnh theo biến động của thị trường
- Xác nhận giao dịch kết hợp với các chỉ số kỹ thuật khác
Hướng tối ưu hóa chiến lược
- Tối ưu hóa tham số:
- Chu kỳ EMA được điều chỉnh theo đặc điểm biến động của các thị trường khác nhau
- Tối ưu hóa chu kỳ ATR và nhân số của Supertrend
- Màn lọc tín hiệu
- Thêm cơ chế xác nhận khối lượng
- Giới thiệu bộ lọc biến động
- Quản lý rủi ro:
- Thực hiện chiến lược dừng lỗ động
- Thêm mô-đun quản lý vị thế
- Thực hiện giao dịch:
- Tối ưu hóa thời gian tuyển sinh
- Thêm chức năng xây dựng và giảm kho hàng loạt
Tóm tắt
Đây là một chiến lược theo dõi xu hướng có cấu trúc, logic rõ ràng. Bằng cách kết hợp hệ thống đường thẳng và chỉ số Supertrend, nó cân bằng hiệu quả giữa độ chính xác và độ trễ của tín hiệu. Thiết kế trực quan của chiến lược và hệ thống hiển thị thông tin giúp thương nhân nhanh chóng đánh giá tình trạng thị trường.
- 1