Chiến lược giao dịch theo xu hướng và phân kỳ của chỉ báo Donchian đa kỳ

Tổng quan
Chiến lược này dựa trên các chỉ số kênh Đường Đông Dương trong nhiều chu kỳ để xây dựng hệ thống theo dõi xu hướng. Bằng cách phân tích sự đột phá của kênh Đường Đông Dương trong các chu kỳ thời gian khác nhau, kết hợp xu hướng chính và mối quan hệ phối hợp của xu hướng địa phương để tạo ra biểu đồ theo dạng dải xu hướng trực quan. Chiến lược sử dụng sự thay đổi màu sắc sâu sắc để hiển thị mức độ yếu của xu hướng, màu xanh lá cây đại diện cho xu hướng tăng, màu đỏ đại diện cho xu hướng giảm, màu sắc sâu hơn cho thấy xu hướng rõ ràng hơn.
Nguyên tắc chiến lược
Cốt lõi của chiến lược này là đánh giá xu hướng dựa trên các chỉ số của kênh Donchian. Các kênh Donchian bao gồm các kênh giá cao nhất và kênh giá thấp nhất, đánh giá xu hướng bằng cách so sánh giá hiện tại với mối quan hệ vị trí của kênh.
- Xác định xu hướng chính: Sử dụng đường Dongxian 20 chu kỳ, khi giá phá vỡ đường lên hình thành xu hướng tăng, phá vỡ đường xuống hình thành xu hướng giảm
- Xác định xu hướng địa phương: Dưới khung xu hướng chính, sử dụng các chu kỳ ngắn hơn của đường Đông Dương để xác định xu hướng địa phương
- Biểu đồ dải xu hướng: hình thành các dải xu hướng thông qua sự kết hợp của 10 chu kỳ khác nhau của đường Đông Dương, màu sắc mờ và mờ phản ánh cường độ xu hướng
- Tín hiệu giao dịch: xu hướng chính lên mở nhiều lệnh, xu hướng chính xuống mở lệnh trống, xu hướng đảo ngược khi đóng lỗ
Lợi thế chiến lược
- Xác định xu hướng khách quan: Xác định xu hướng dựa trên giá đột phá, tránh sự sai lệch do phán đoán chủ quan gây ra
- Xác định nhiều chu kỳ: Tăng độ chính xác trong việc đánh giá xu hướng bằng cách chồng lên các xu hướng khác nhau
- Hiệu ứng trực quan: Biến đổi màu sắc của dải xu hướng trực quan hiển thị trạng thái thị trường
- Quy tắc giao dịch rõ ràng: tín hiệu nhập và xuất rõ ràng, dễ dàng thực hiện theo chương trình
- Khả năng thích ứng: có thể điều chỉnh các tham số để tối ưu hóa hiệu suất chiến lược tùy thuộc vào đặc điểm của loại giao dịch
Rủi ro chiến lược
- Rủi ro đảo ngược xu hướng: Có thể có sự rút lui lớn hơn tại điểm đảo ngược xu hướng
- Không áp dụng cho thị trường chấn động: Chấn động ngang có thể tạo ra tín hiệu sai
- Tính nhạy cảm của tham số: các thiết lập tham số khác nhau có thể ảnh hưởng đáng kể đến hiệu quả của chiến lược
- Tác động điểm trượt: giao dịch thường xuyên có thể bị ảnh hưởng bởi điểm trượt
- Rủi ro hệ thống: Sự kiện bất ngờ trên thị trường có thể gây ra tổn thất lớn
Hướng tối ưu hóa chiến lược
- Tăng bộ lọc cường độ xu hướng: giới thiệu các chỉ số cường độ xu hướng như ADX, lọc các tín hiệu xu hướng yếu
- Cài đặt dừng tối ưu hóa: Điều chỉnh vị trí dừng động dựa trên ATR để cải thiện khả năng kiểm soát rủi ro
- Thêm xác nhận giao dịch: tích hợp phân tích giao dịch để xác minh hiệu quả của xu hướng
- Giới thiệu điều chỉnh tỷ lệ biến động: tham số điều chỉnh động theo biến động tỷ lệ thị trường
- Quản lý vị trí tốt hơn: Điều chỉnh kích thước giữ vị trí theo xu hướng
Tóm tắt
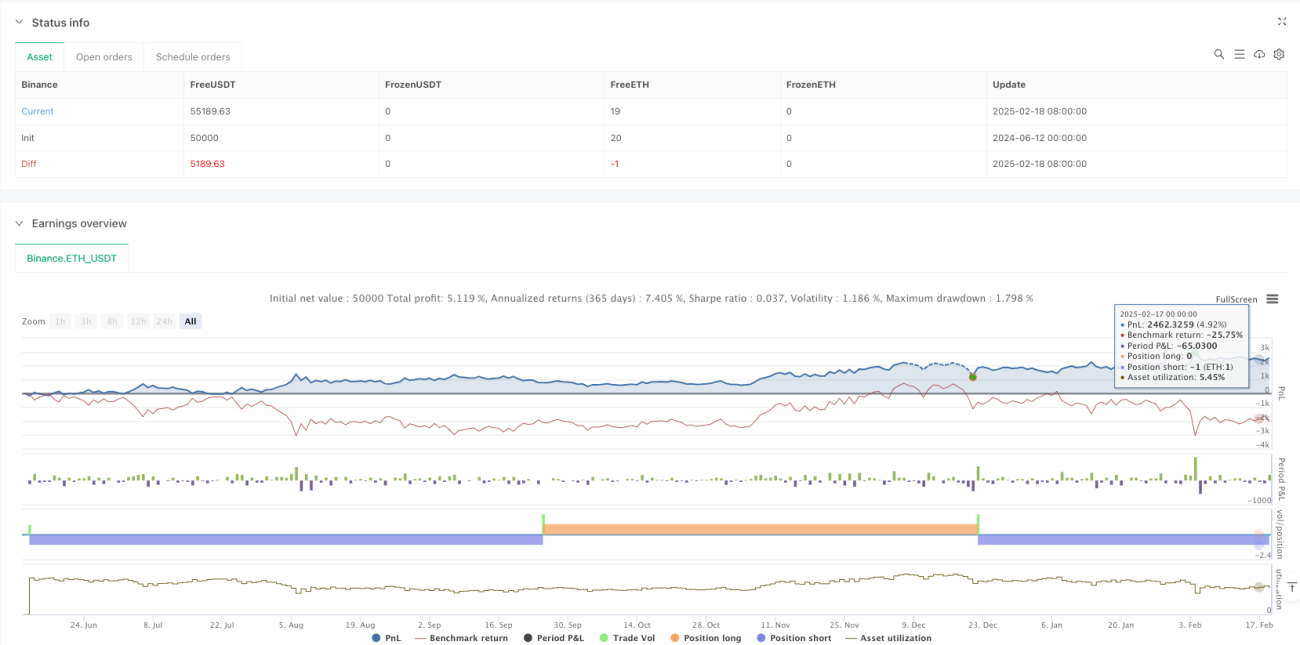
Chiến lược này có giá trị ứng dụng thực tế tốt thông qua các biện pháp tối ưu hóa tham số và kiểm soát rủi ro hợp lý. Người giao dịch được khuyến khích chú ý đến lựa chọn môi trường thị trường khi áp dụng thực tế và quản lý vị trí phù hợp với khả năng chịu rủi ro của mình.
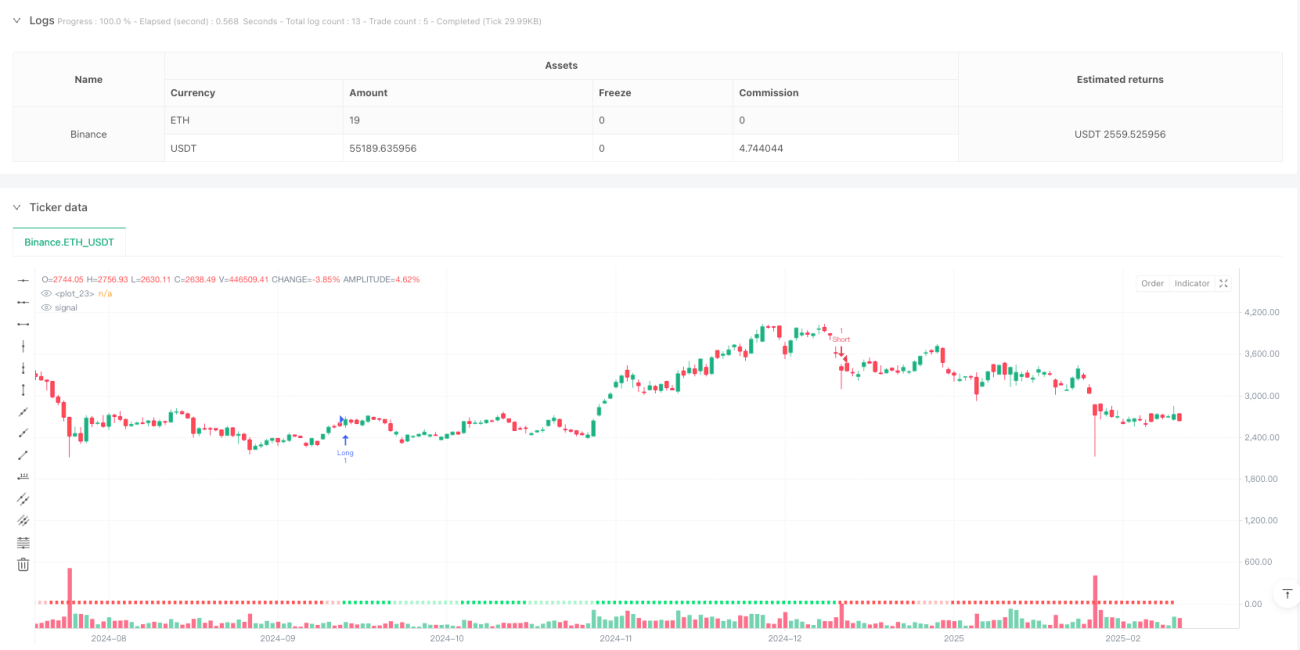
/*backtest
start: 2024-06-12 00:00:00
end: 2025-02-19 08:00:00
period: 1d
basePeriod: 1d
exchanges: [{"eid":"Binance","currency":"ETH_USDT"}]
*/

//@version=6
strategy("Donchian Trend Ribbon Strategy", shorttitle="DonchianTrendRibbonStrat", overlay=true, precision=0)

//~~~~~~~~~~~~~~~~~~~~~~~~~~~~~~~~~~~~~~~~~~~~~~~~~~~~~~~~~~~~~~~~~~~~~~~~~~~~~~- 1