
Tổng quan
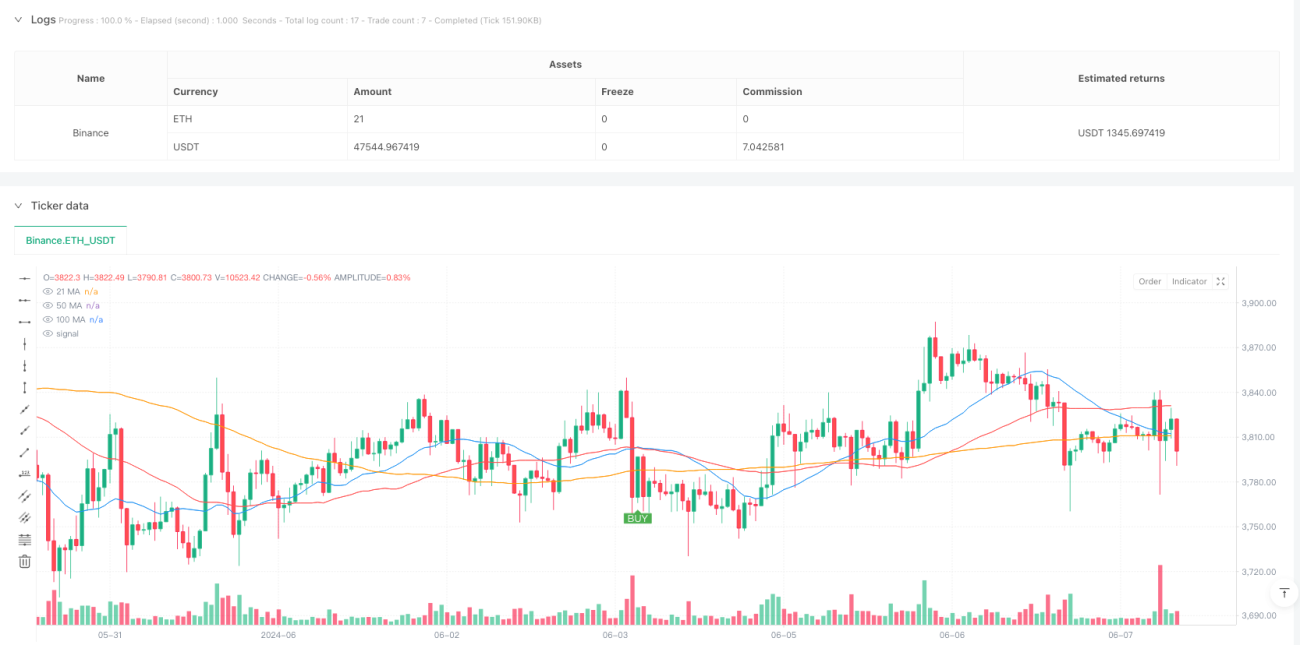
Đây là một chiến lược theo dõi xu hướng dựa trên ba đường trung bình di chuyển đơn giản (SMA). Chiến lược này sử dụng mối quan hệ chéo và vị trí của các đường trung bình di chuyển chu kỳ 21, 50 và 100 để xác định xu hướng thị trường và giao dịch vào thời điểm thích hợp. Chiến lược này hoạt động chủ yếu trên khung thời gian 5 phút, đồng thời đề nghị tham khảo biểu đồ 30 phút để xác nhận xu hướng.
Nguyên tắc chiến lược
Chiến lược sử dụng hệ thống lọc ba lần để xác định tín hiệu giao dịch:
- Sử dụng đường trung bình 21 chu kỳ làm đường trung bình nhanh để nắm bắt biến động giá ngắn hạn
- Sử dụng đường trung bình 50 chu kỳ làm đường trung bình trung bình, hình thành tín hiệu chéo với đường trung bình nhanh
- Sử dụng đường trung bình 100 chu kỳ làm bộ lọc xu hướng để đảm bảo hướng giao dịch phù hợp với xu hướng chính
Các điều kiện mua phải được đáp ứng cùng lúc:
- 21 đường trung bình đi lên qua đường trung bình 50.
- 21 và 50 đều nằm trên 100
Các điều kiện bán hàng phải được đáp ứng:
- Đường trung bình 21 đi xuống qua đường trung bình 50.
- 21 và 50 đều nằm dưới 100
Lợi thế chiến lược
- Cơ chế xác nhận nhiều lần làm giảm tín hiệu giả
- Trình lọc xu hướng làm tăng tỷ lệ giao dịch thành công
- Quy tắc nhập cảnh và xuất cảnh rõ ràng
- Có thể sử dụng trên nhiều khung thời gian
- Tỷ lệ rủi ro / lợi nhuận được thiết lập là 1: 2, thuận lợi cho lợi nhuận dài hạn
- Logic của chiến lược đơn giản, dễ hiểu và dễ thực hiện
Rủi ro chiến lược
- Thị trường chấn động có thể dẫn đến giao dịch thường xuyên
- Sự chậm trễ của đường trung bình có thể gây ra sự chậm trễ trong và ngoài trận đấu
- Sự thay đổi nhanh chóng có thể gây ra thiệt hại lớn
- Các tham số cần điều chỉnh cho các môi trường thị trường khác nhau
Đề xuất kiểm soát rủi ro:
- Thiết lập dừng lỗ bên dưới điểm thấp quan trọng gần nhất
- Xu hướng xác nhận kết hợp với chu kỳ thời gian lớn hơn
- Tránh giao dịch trên thị trường dao động ngang
- Thường xuyên đánh giá và tối ưu hóa các tham số chiến lược
Hướng tối ưu hóa chiến lược
- Tiến hành giới thiệu chỉ số giao dịch xác nhận cường độ xu hướng
- Tăng cơ chế dừng lỗ động
- Thêm Bộ lọc Sức mạnh Xu hướng
- Cơ chế thích ứng cho các tham số tối ưu hóa
- Chứng nhận tín hiệu kết hợp với các chỉ số kỹ thuật khác
- Tăng bộ lọc biến động thị trường
Tóm tắt
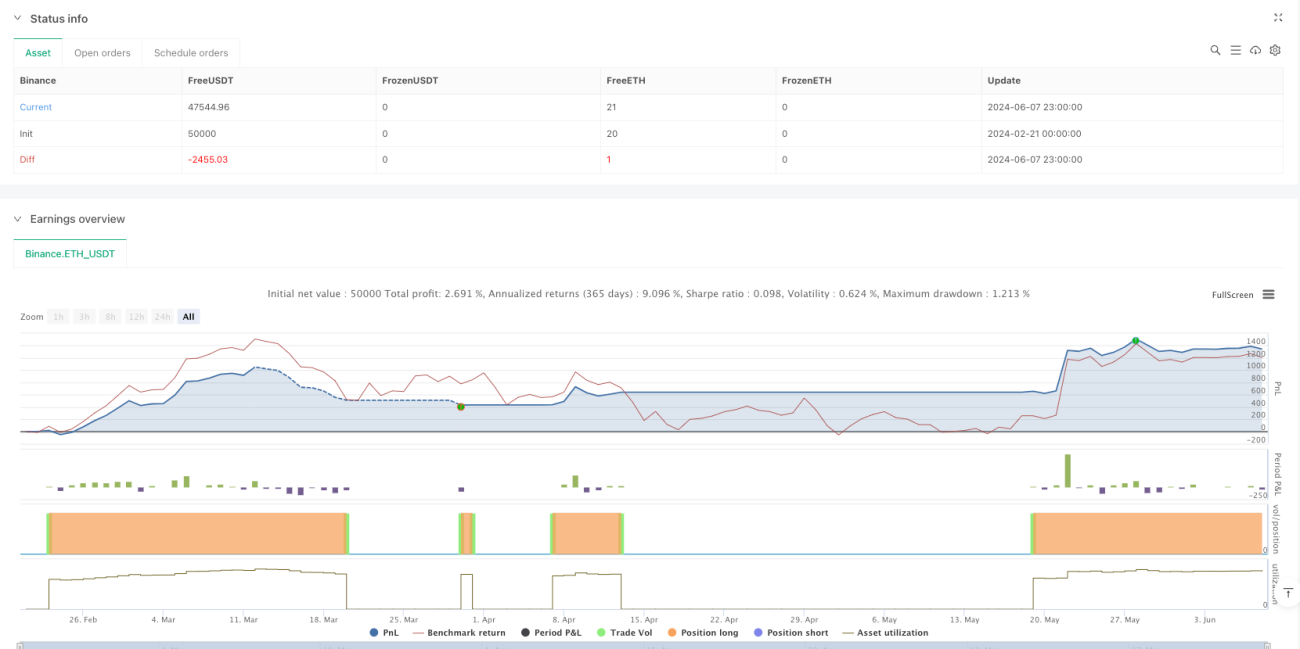
Đây là một chiến lược theo dõi xu hướng có cấu trúc, logic rõ ràng. Với bộ lọc ba dòng đồng nhất và cơ chế xác nhận xu hướng, nó có thể làm giảm hiệu quả tín hiệu sai và tăng tỷ lệ thành công của giao dịch. Chiến lược có khả năng mở rộng tốt, có thể điều chỉnh tối ưu hóa theo môi trường thị trường khác nhau.
/*backtest
start: 2024-02-21 00:00:00
end: 2024-06-08 00:00:00
period: 1h
basePeriod: 1h
exchanges: [{"eid":"Binance","currency":"ETH_USDT"}]
*/

// This Pine Script™ code is subject to the terms of the Mozilla Public License 2.0 at https://mozilla.org/MPL/2.0/
// © Vezpa
//@version=5
strategy("Vezpa's Gold Strategy", overlay=true)- 1