
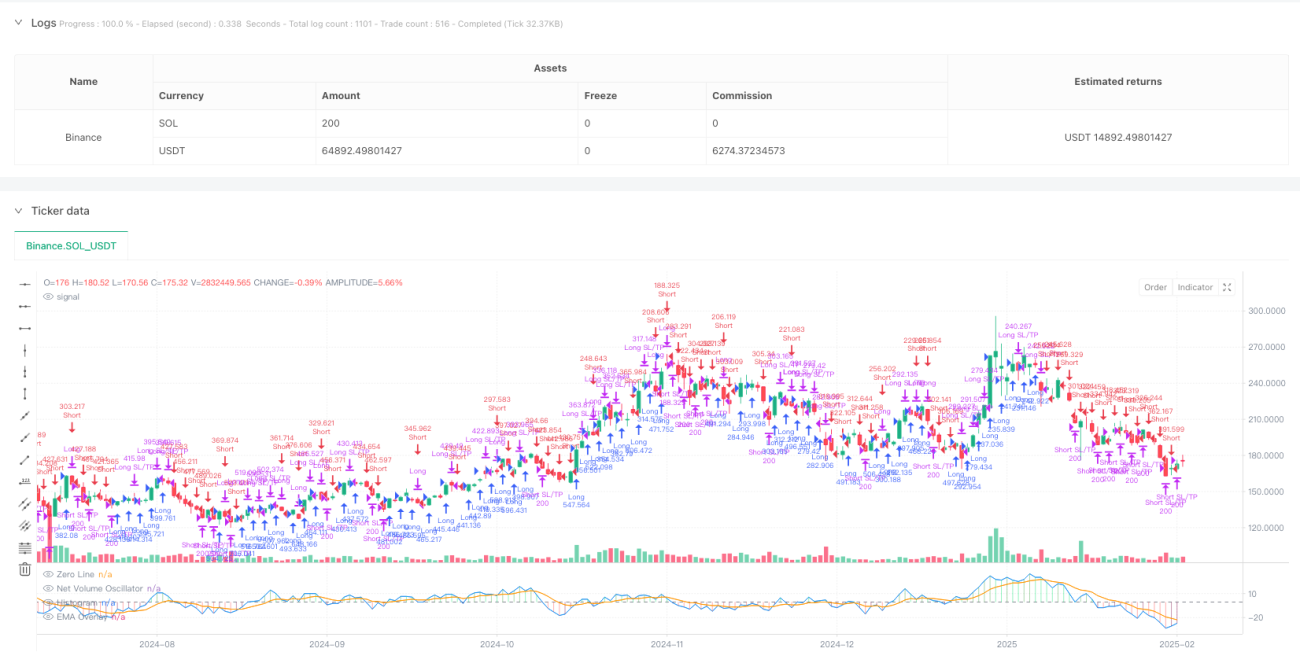
Tổng quan
Chiến lược này là một hệ thống theo dõi xu hướng dựa trên khối lượng giao dịch và biến động giá để dự đoán xu hướng thị trường bằng cách tính toán chỉ số biến động khối lượng giao dịch ròng (NVO). Chiến lược kết hợp nhiều loại trung bình di chuyển (EMA, WMA, SMA, HMA) để đánh giá xu hướng thị trường bằng cách so sánh các chỉ số biến động với mối quan hệ vị trí của đường chồng lên EMA của nó và giao dịch vào thời điểm thích hợp.
Nguyên tắc chiến lược
Trọng tâm của chiến lược là đánh giá tâm trạng thị trường bằng cách tính toán giá trị biến động khối lượng giao dịch ròng hàng ngày. Các bước tính toán cụ thể như sau:
- Tính toán giá đúp: tính toán một giá đúp giữa 0-1 dựa trên giá cao nhất, giá thấp nhất và giá đóng cửa trong ngày
- Tính toán khối lượng giao dịch tăng và giảm hiệu quả: Góp trọng lượng theo hướng biến động của giá và nhân khối lượng giao dịch
- Tính toán khối lượng giao dịch ròng: lấy khối lượng giao dịch tăng hiệu quả trừ khối lượng giao dịch giảm hiệu quả
- Điểm trung bình di chuyển được chọn trong ứng dụng: xử lý dữ liệu khối lượng giao dịch ròng
- Tính toán đường chồng chéo EMA: đường tham chiếu để đánh giá xu hướng
- Tính toán tỷ lệ thay đổi (ROC): được sử dụng để đánh giá sự thay đổi cường độ của xu hướng
Các tín hiệu giao dịch được tạo ra dựa trên các quy tắc sau:
- Làm nhiều điều kiện: Đeo dây xếp chồng EMA trên chỉ số chấn động
- Điều kiện làm không: Đi qua dây chồng lên EMA dưới chỉ số chấn động
- Stop loss: Stop loss dựa trên tỷ lệ phần trăm
- Cứu giá: Cứu giá dựa trên tỷ lệ phần trăm
Lợi thế chiến lược
- Phân tích đa chiều: thông tin thị trường kết hợp ba chiều của giá cả, khối lượng giao dịch và tỷ lệ thay đổi xu hướng
- Tính linh hoạt cao: hỗ trợ nhiều loại moving average, có thể điều chỉnh theo các đặc điểm thị trường khác nhau
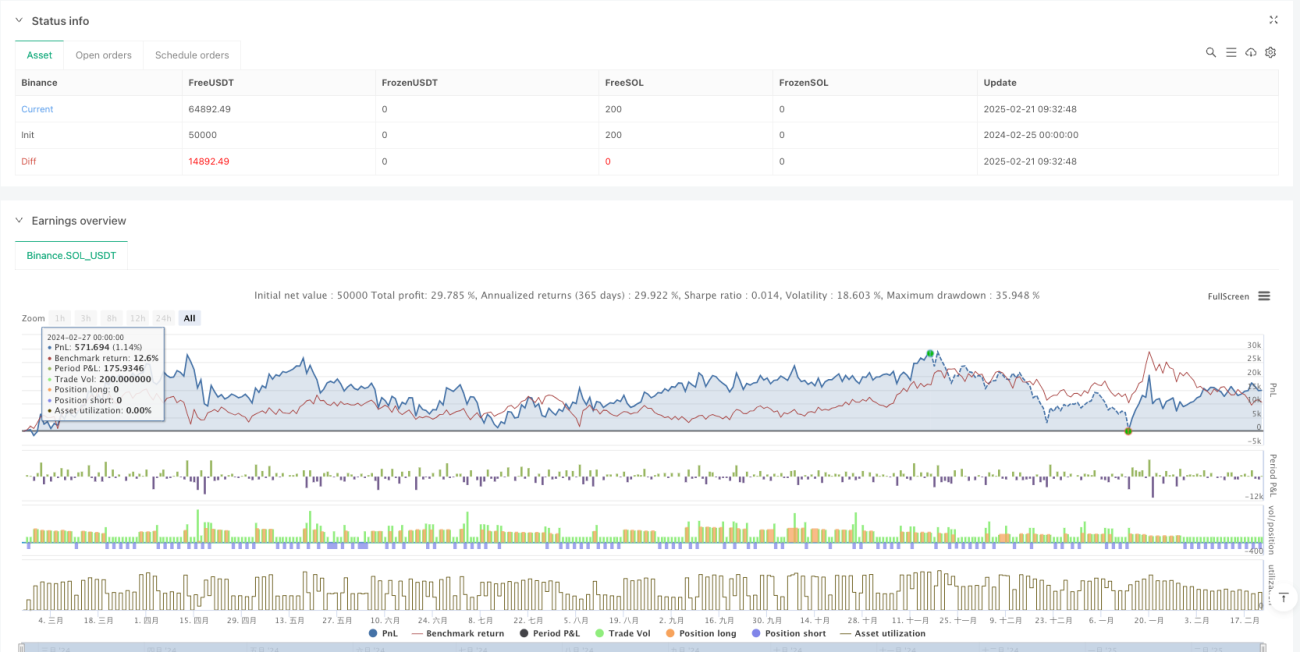
- Quản lý rủi ro tốt: bao gồm các cơ chế ngăn chặn, kiểm soát rủi ro hiệu quả
- Hiển thị hiệu quả mạnh mẽ: Hiển thị sự thay đổi cường độ xu hướng thông qua biểu đồ thẳng đứng, giúp hiểu được tình trạng thị trường
- Khả năng thích ứng: có thể thích ứng với các môi trường thị trường khác nhau và các loại giao dịch thông qua thiết kế tham số
Rủi ro chiến lược
- Rủi ro đảo ngược xu hướng: có thể tạo ra các tín hiệu sai lệch thường xuyên trong thị trường bất ổn
- Rủi ro về sự chậm trễ: Đường trung bình di chuyển tự nó có một sự chậm trễ, có thể dẫn đến thời gian nhập cảnh và xuất cảnh không phù hợp
- Độ nhạy của tham số: Các kết hợp tham số khác nhau có thể dẫn đến sự khác biệt lớn về hiệu suất chiến lược
- Tùy thuộc vào môi trường thị trường: có thể không hoạt động tốt trong một số môi trường thị trường
- Hạn chế về mặt kỹ thuật: chỉ dựa vào các chỉ số kỹ thuật, không xem xét các yếu tố cơ bản
Đề xuất kiểm soát rủi ro:
- Khuyến nghị tối ưu hóa tham số trong các môi trường thị trường khác nhau
- Có thể kết hợp với các chỉ số kỹ thuật khác để xác nhận tín hiệu
- Điều chỉnh đúng các tham số dừng lỗ để thích ứng với sự biến động khác nhau của thị trường
Hướng tối ưu hóa chiến lược
-
Các cơ chế xác nhận tín hiệu được tối ưu hóa:
- Thêm điều kiện xác nhận số lượng giao hàng
- Thêm Bộ lọc Sức mạnh Xu hướng
- Giới thiệu cơ chế thích ứng với biến động
-
Tối ưu hóa quản lý rủi ro:
- Thực hiện cơ chế dừng lỗ động
- Thêm mô-đun quản lý tài chính
- Tiến hành cơ chế xây dựng và tháo dỡ kho hàng loạt
-
Tối ưu hóa tham số:
- Phát triển cơ chế điều chỉnh tham số thích ứng
- Thực hiện chuyển đổi tham số dựa trên môi trường thị trường
- Thêm mô hình học máy để tối ưu hóa tham số
Tóm tắt
Chiến lược này xây dựng một hệ thống giao dịch theo dõi xu hướng hoàn chỉnh hơn bằng cách phân tích tích hợp khối lượng giao dịch và dữ liệu giá. Đặc điểm chính của chiến lược là kết hợp nhiều chỉ số kỹ thuật và cung cấp các tùy chọn cấu hình tham số linh hoạt. Mặc dù có một số rủi ro, nhưng thông qua kiểm soát rủi ro hợp lý và tối ưu hóa liên tục, chiến lược này có thể đạt được lợi nhuận ổn định trong giao dịch thực tế.
/*backtest
start: 2024-02-25 00:00:00
end: 2025-02-22 08:00:00
period: 1d
basePeriod: 1d
exchanges: [{"eid":"Binance","currency":"SOL_USDT"}]
*/

//@version=5
strategy("EMA-Based Net Volume Oscillator with Trend Change", shorttitle="NVO Trend Change", overlay=false, initial_capital=100000, default_qty_type=strategy.percent_of_equity, default_qty_value=100)

// Input parameters- 1