Chiến lược định lượng dừng lỗ động chéo kép EMA

2
Follow
480
Followers
Tổng quan
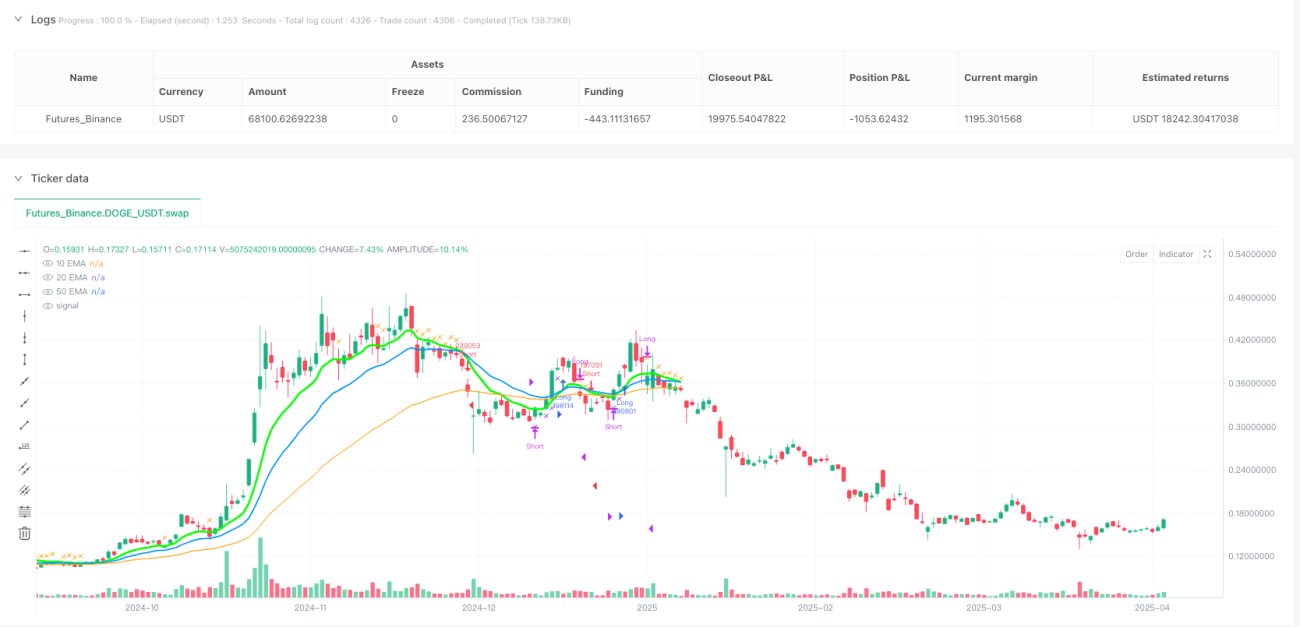
Chiến lược này dựa trên nguyên tắc giao chéo kép của đường trung bình di chuyển chỉ số ((EMA), kết hợp với thiết kế cơ chế dừng động. Chiến lược sử dụng EMA ngày 10 và EMA ngày 20 như là tín hiệu giao dịch chính, và sử dụng EMA ngày 50 như là bộ lọc xu hướng, đồng thời sử dụng EMA ngày 10 như là đường dừng động.
Nguyên tắc chiến lược
- Đánh giá điều kiện đa không:
- Điều kiện đa đầu: Khi EMA 10 ngày đi qua EMA 20 ngày từ phía dưới và giá đóng cửa hiện tại cao hơn EMA 50 ngày, xác nhận xu hướng đa đầu được thiết lập.
- Điều kiện tròn: Khi 10 ngày EMA vượt qua 20 ngày EMA (đá chết) từ phía trên và giá đóng cửa hiện tại thấp hơn 50 ngày EMA, xác nhận xu hướng tròn.
- Cơ chế dừng lỗ động:
- Trong quá trình giữ nhiều vị trí, nếu giá đóng cửa giảm xuống dưới EMA ngày 10, nó sẽ kích hoạt lệnh dừng lỗ.
- Trong thời gian giữ vị thế đầu trống, nếu giá đóng cửa vượt quá EMA ngày 10, nó sẽ kích hoạt lệnh dừng lỗ.
- Trình lọc xu hướng:50 ngày EMA là bộ lọc xu hướng dài hạn, tránh giao dịch thường xuyên trong bối cảnh biến động.
Phân tích lợi thế
- Khả năng theo dõi xu hướng: Giao chéo EMA kép có hiệu quả trong việc nắm bắt xu hướng trung hạn, lọc EMA 50 ngày làm giảm tín hiệu giả.
- Quản lý rủi ro động10: EMA là đường dừng động, có thể được điều chỉnh theo xu hướng để thoát khỏi điểm, bảo vệ lợi nhuận.
- Thiết kế hình ảnh: Nhờ phân biệt ba EMA bằng màu sắc và đường nét khác nhau, và đánh dấu các tín hiệu mua bán, để dễ dàng theo dõi trong thời gian thực.
- Thể điều chỉnh tham sốChu kỳ EMA có thể được điều chỉnh linh hoạt bằng các tham số đầu vào để thích ứng với các biến động thị trường khác nhau.
Phân tích rủi ro
- Rủi ro của sự chậm trễEMA đã tính toán dựa trên dữ liệu lịch sử rằng có thể có một sự rút lui lớn hơn trong một sự thay đổi nhanh chóng.
- Giải pháp: kết hợp các chỉ số động lượng ((như RSI) lọc biến động cực đoan.
- Thâm hụt của thị trườngTrong trường hợp không có xu hướng, các tín hiệu chéo có thể thường xuyên kích hoạt các giao dịch không có hiệu lực.
- Giải pháp: giới thiệu các chỉ số biến động (như ATR) tạm dừng giao dịch.
- Các tham số không phù hợp: Chu kỳ EMA cố định có thể không phù hợp với tất cả các tình trạng thị trường.
- Giải pháp: Sử dụng thuật toán chu kỳ thích ứng hoặc xác minh nhiều khung thời gian.
Hướng tối ưu hóa
- Tăng cường tín hiệu tổng hợp:
- Tăng xác nhận số lượng giao dịch (ví dụ như tăng cường khi đột phá), nâng cao độ tin cậy tín hiệu.
- Quản lý vị trí động:
- Điều chỉnh kích thước vị trí theo biến động (ATR) để giảm tiếp xúc vào thời điểm rủi ro cao.
- Tối ưu hóa học máy:
- Sử dụng mô hình đào tạo dữ liệu lịch sử để tối ưu hóa động lực cho bảng xếp hạng chu kỳ EMA
- Xác thực nhiều khung thời gian:
- Yêu cầu hướng EMA cấp vòng tròn phù hợp với tín hiệu đường mặt trời, tăng tỷ lệ thắng.
Tóm tắt
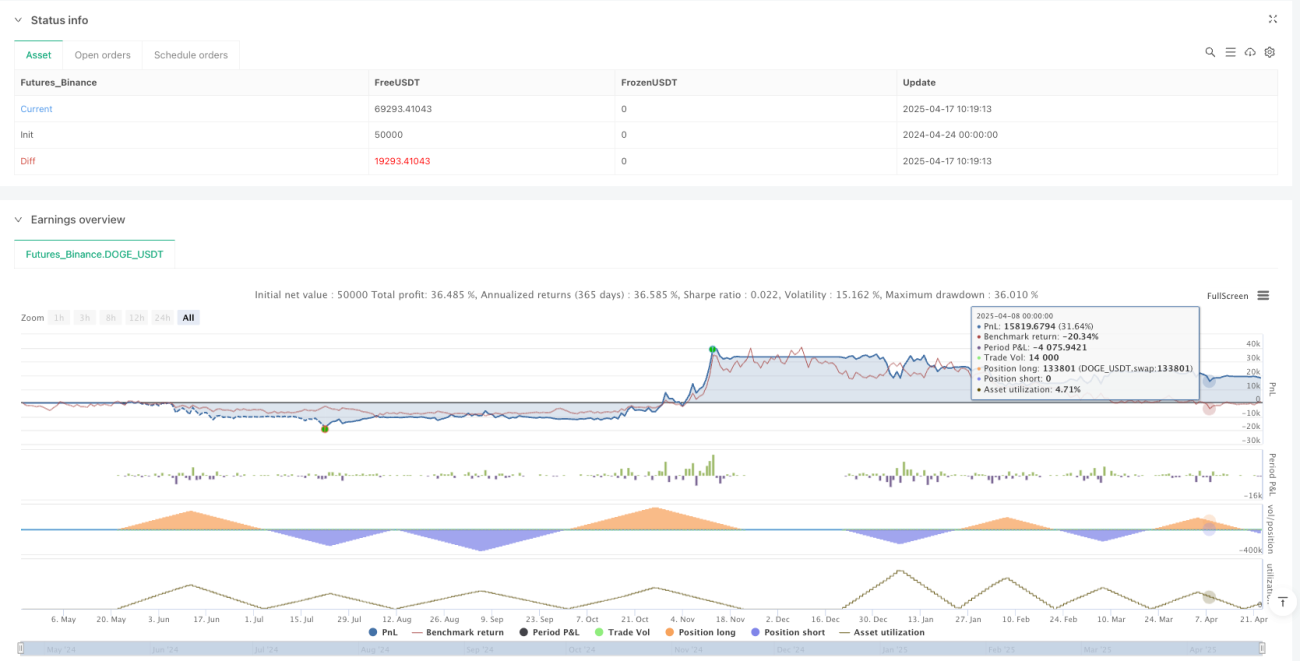
Chiến lược này đạt được sự cân bằng giữa theo dõi xu hướng và kiểm soát rủi ro thông qua sự kết hợp của EMA và dừng động. Điểm mạnh cốt lõi của nó là cấu trúc logic rõ ràng và thiết kế hình ảnh trực quan, phù hợp với bối cảnh giao dịch tần số trung bình và thấp.
Source
Pine
Strategy parameters
Related strategies
Comment
All comments (0)
No data
- 1