Chiến lược nhân tham số: Máy nhịp thị trường tích hợp đa chỉ báo

🎯 Đây là chiến lược thần thánh gì vậy?
Bạn biết không? Chiến lược này giống như gắn một "radar siêu cấp" cho thị trường vậy! Không chỉ đơn giản nhìn vào một hay hai chỉ báo, mà nó kết hợp 9 chỉ báo kỹ thuật khác nhau lại với nhau như một ban nhạc, mỗi chỉ báo là một "nhạc cụ", chỉ khi chúng cùng tạo ra những "nốt nhạc" hài hòa, chiến lược mới phát ra tín hiệu giao dịch. Hãy tưởng tượng, điều này giống như có 9 chuyên gia cùng lúc thì thầm lời khuyên bên tai bạn, chỉ khi đa số đồng ý, bạn mới hành động!
📊 Tiết lộ nguyên lý cốt lõi
Gạch đầu dòng nhé! Tinh túy của chiến lược này nằm ở khái niệm "hệ số nhân tham số". Nó chuẩn hóa các chỉ báo như RSI, ADX, Momentum, ROC, ATR, Volume, Acceleration và Slope về cùng một thang đo, sau đó nhân chúng với nhau để có được một "giá trị sức mạnh tổng hợp". Giống như nấu ăn vậy, mỗi loại gia vị đều có tỷ lệ tối ưu, chiến lược này giúp bạn tìm ra sự pha trộn hoàn hảo của các "gia vị" thị trường! Khi giá trị sức mạnh tổng hợp vượt qua đường trung bình động của nó, đó chính là thời điểm vàng để vào lệnh.
🔧 Vũ khí lợi hại có thể tùy chỉnh
Điều tuyệt vời nhất của chiến lược này là gì? Bạn có thể tự do kết hợp như lắp ghép lego vậy! Không muốn dùng chỉ báo nào? Tắt nó đi ngay. Muốn điều chỉnh chu kỳ tham số? Tùy bạn. Thậm chí còn có bộ lọc xu hướng SMA, giúp bạn tránh xa cái bẫy giao dịch ngược xu hướng. Điều này giống như một "bộ công cụ DIY chiến lược giao dịch", cho phép bạn điều chỉnh cấu hình phù hợp với các điều kiện thị trường khác nhau.
⚡ Hướng dẫn ứng dụng thực chiến
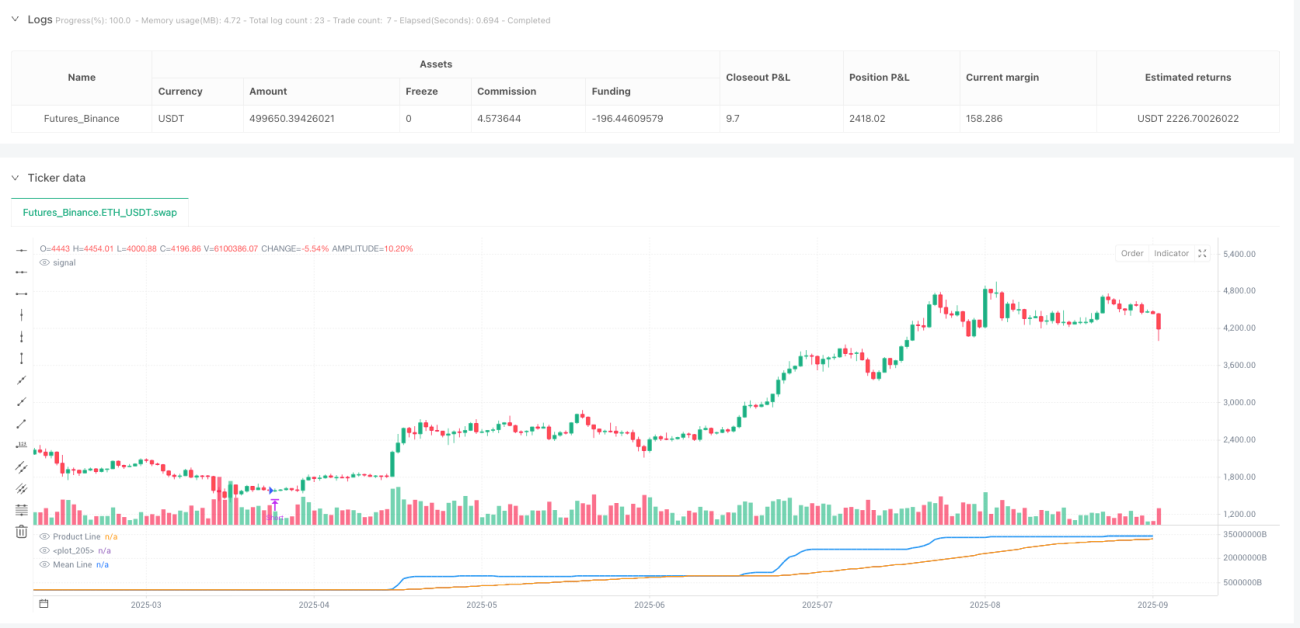
Hướng dẫn tránh sai lầm đây! Chiến lược này đặc biệt phù hợp với môi trường thị trường dao động và xu hướng hỗn hợp. Khi đường sản phẩm màu xanh vượt lên trên đường trung bình động màu cam, bạn mua vào; khi vượt xuống dưới, bạn bán ra. Chiến lược còn được tích hợp cơ chế đóng vị thế tự động, giúp bạn không còn ngốc nghếch giữ lệnh khi tín hiệu ngược chiều xuất hiện. Hãy nhớ, bật bộ lọc xu hướng sẽ giúp bạn ung dung trong xu hướng lớn, còn tắt nó sẽ cho phép bạn nắm bắt nhiều cơ hội ngắn hạn hơn!
//@version=5
strategy("Parametric Multiplier Backtester", shorttitle="PMB", overlay=false)

// Author: Script_Algo
// License: MIT
// Permission is hereby granted, free of charge, to any person obtaining a copy
// of this software and associated documentation files (the "Software"), to deal
// in the Software without restriction, including without limitation the rights
// to use, copy, modify, merge, publish, distribute, sublicense, and/or sell
// copies of the Software, subject to the following conditions:
// The above copyright notice and this permission notice shall be included in
// all copies or substantial portions of the Software.- 1