Ichimoku Cloud Smooth Oscillator

Author: ChaoZhang, Date: 2022-05-09 12:14:12
Tags: EMA

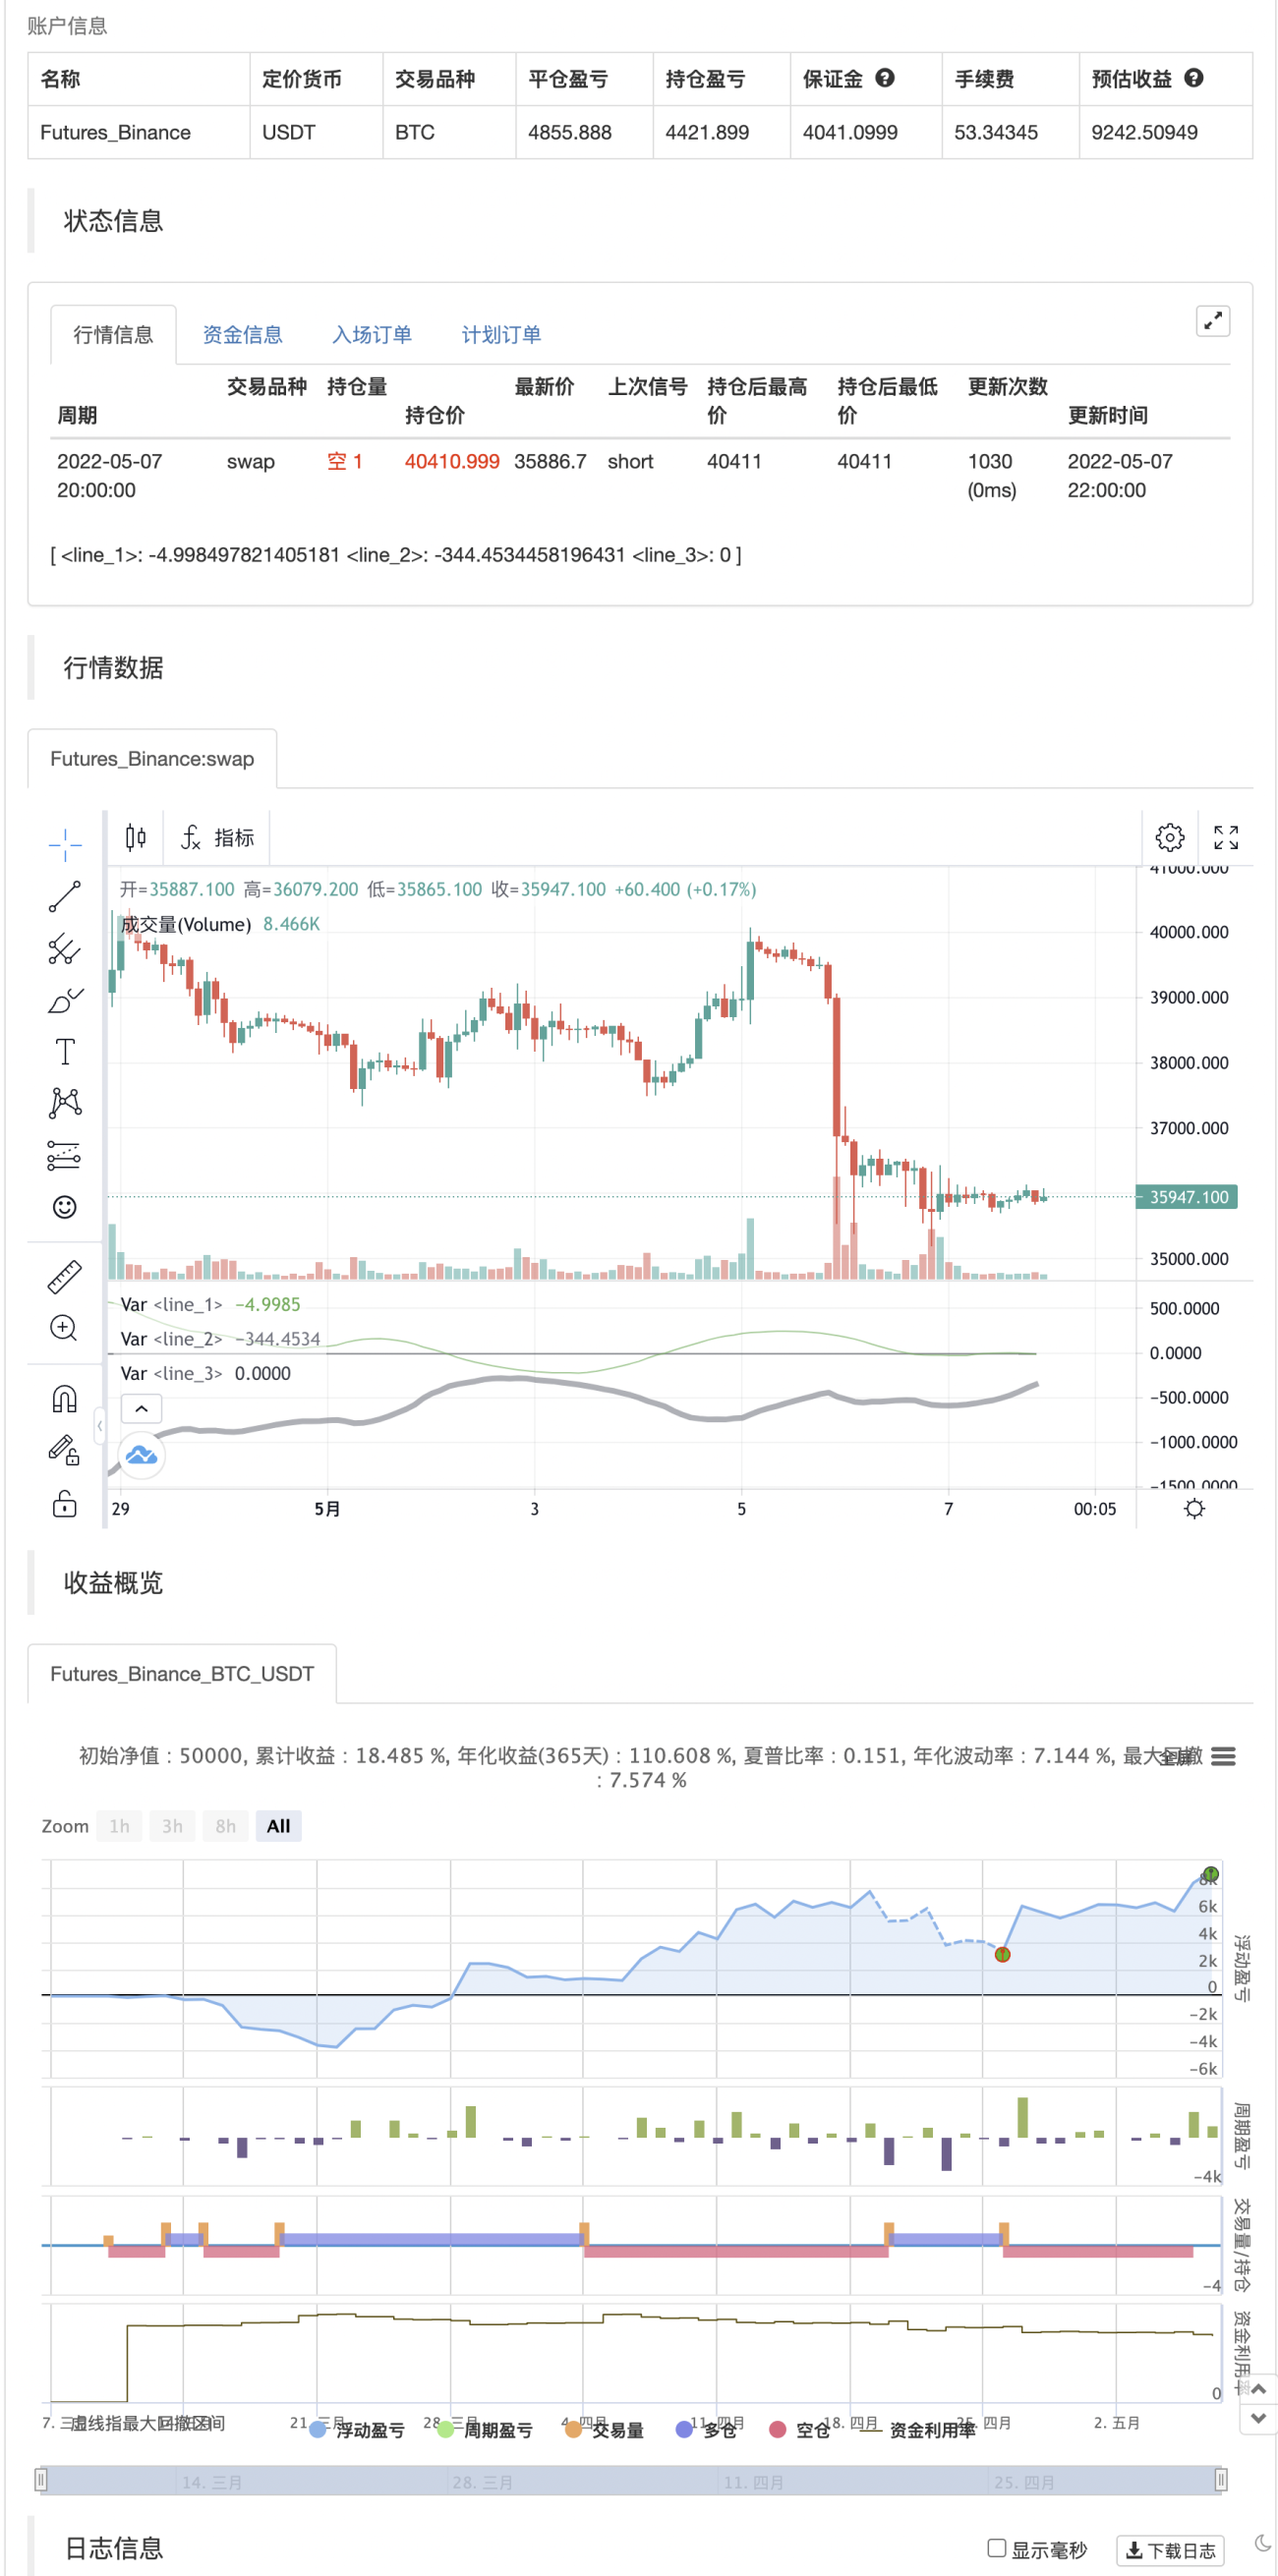
The Ichimoku Cloud is a powerful indicator to track trends. By smoothing it and placing it in a separate chart, the signals can be easily identified without cluttering the display. The bold line is the signal: green indicates a buy signal while red indicates a sell signal. Gray represents a possible change in direction and the lack of a trend. The thinner line is the width of the cloud which can be used to further determine the direction.

backtest

img


/*backtest
start: 2022-03-08 00:00:00
end: 2022-05-07 23:59:00
period: 2h
basePeriod: 15m
exchanges: [{"eid":"Futures_Binance","currency":"BTC_USDT"}]
*/

//@version=4

study(title="Ichimoku Cloud Smooth Oscillator")
conversionPeriods = input(9, minval=1, title="Conversion Line Periods"),
basePeriods = input(26, minval=1, title="Base Line Periods")
laggingSpan2Periods = input(52, minval=1, title="Lagging Span 2 Periods"),
pivotPeriods = input(52, minval=1, title="Pivot Periods"),
displacement = input(26, minval=1, title="Displacement")

//T3 constants
b = 0.7
c1 = -b*b*b
c2 = 3*b*b+3*b*b*b
c3 = -6*b*b-3*b-3*b*b*b
c4 = 1+3*b+b*b*b+3*b*b
//T3 constants end

t3n(source,len) => c1 * ema(ema(ema(ema(ema(ema(source, len), len), len), len), len), len) + c2 * ema(ema(ema(ema(ema(source, len), len), len), len), len) + c3 * ema(ema(ema(ema(source, len), len), len), len) + c4 * ema(ema(ema(source, len), len), len)

conversionLine = t3n(close,conversionPeriods)
baseLine = t3n(close,basePeriods)
leadLine1 = avg(conversionLine, baseLine)[displacement]
leadLine2 = t3n(close,laggingSpan2Periods)[displacement]
middleLine = avg(leadLine1, leadLine2)
cloudHeight = leadLine1-leadLine2
conversionDistance = conversionLine-middleLine

var conversionCloudDistance = 0.0

if conversionDistance > 1/2*abs(cloudHeight) or conversionDistance < -1/2*abs(cloudHeight)
    conversionCloudDistance := conversionDistance - abs(cloudHeight) / 2
else
    conversionCloudDistance := 0

var conversionColor = color.green
if conversionCloudDistance > 0
    conversionColor := color.green
else if conversionCloudDistance < 0
    conversionColor := color.red
else
    conversionColor := color.gray
    
cloudColor = cloudHeight > 0 ? color.green : color.red
p1 = plot(cloudHeight, color=cloudColor)
p2 = plot(conversionCloudDistance, color=conversionColor, linewidth = 4)
plot(0, color=color.black)


if conversionCloudDistance>0
    strategy.entry("Enter Long", strategy.long)
else if conversionCloudDistance<0
    strategy.entry("Enter Short", strategy.short)


Related

More