RSI MTF Ob+Os

12
Follow
657
Followers
Hello Traders,
This indicator use the same concept as my previous indicator "CCI MTF Ob+Os".
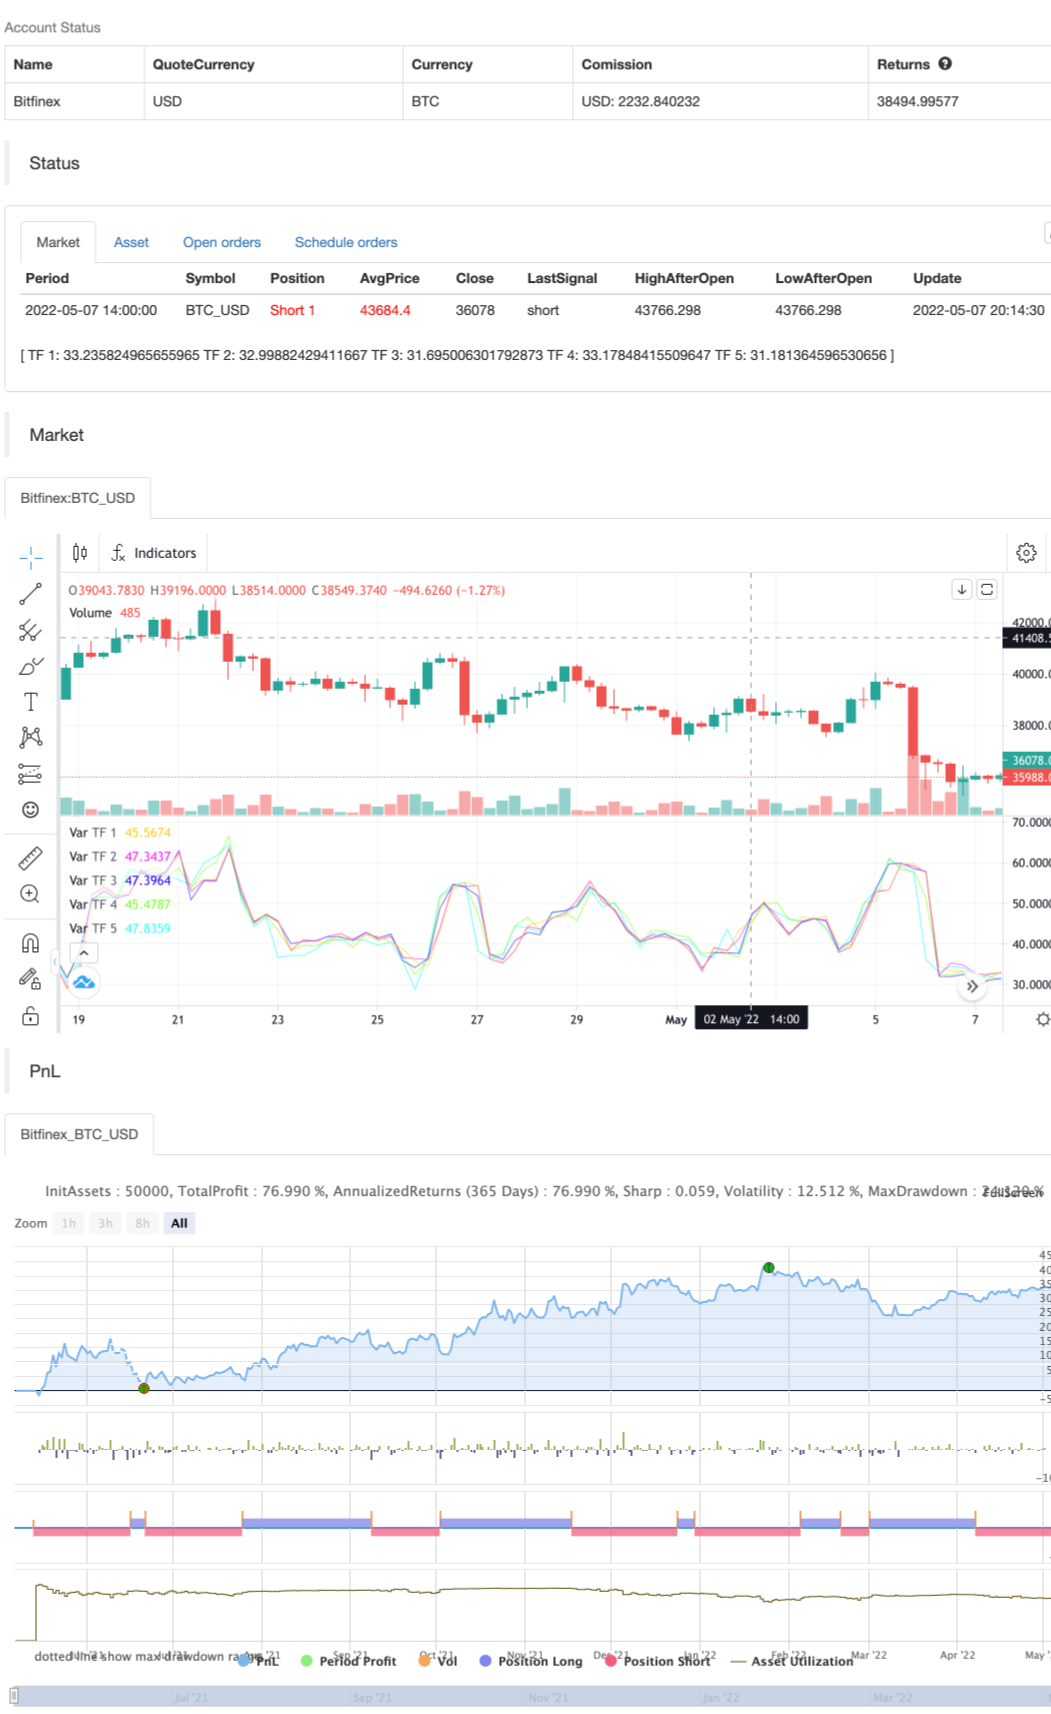
It is a simple "Relative Strength Index" ( RSI ) indicator with multi-timeframe (MTF) overbought and oversold level.
It can detect overbought and oversold level up to 5 timeframes, which help traders spot potential reversal point more easily.
There are options to select 1-5 timeframes to detect overbought and oversold.
Aqua Background is "Oversold" , looking for "Long".
Orange Background is "Overbought" , looking for "Short".
Have fun :)
Source
Pine
Strategy parameters
Related strategies
Comment
All comments (0)
No data
- 1