stoch supertrd atr 200ma

Author: ChaoZhang, Date: 2022-05-10 10:53:25
Tags: EMA

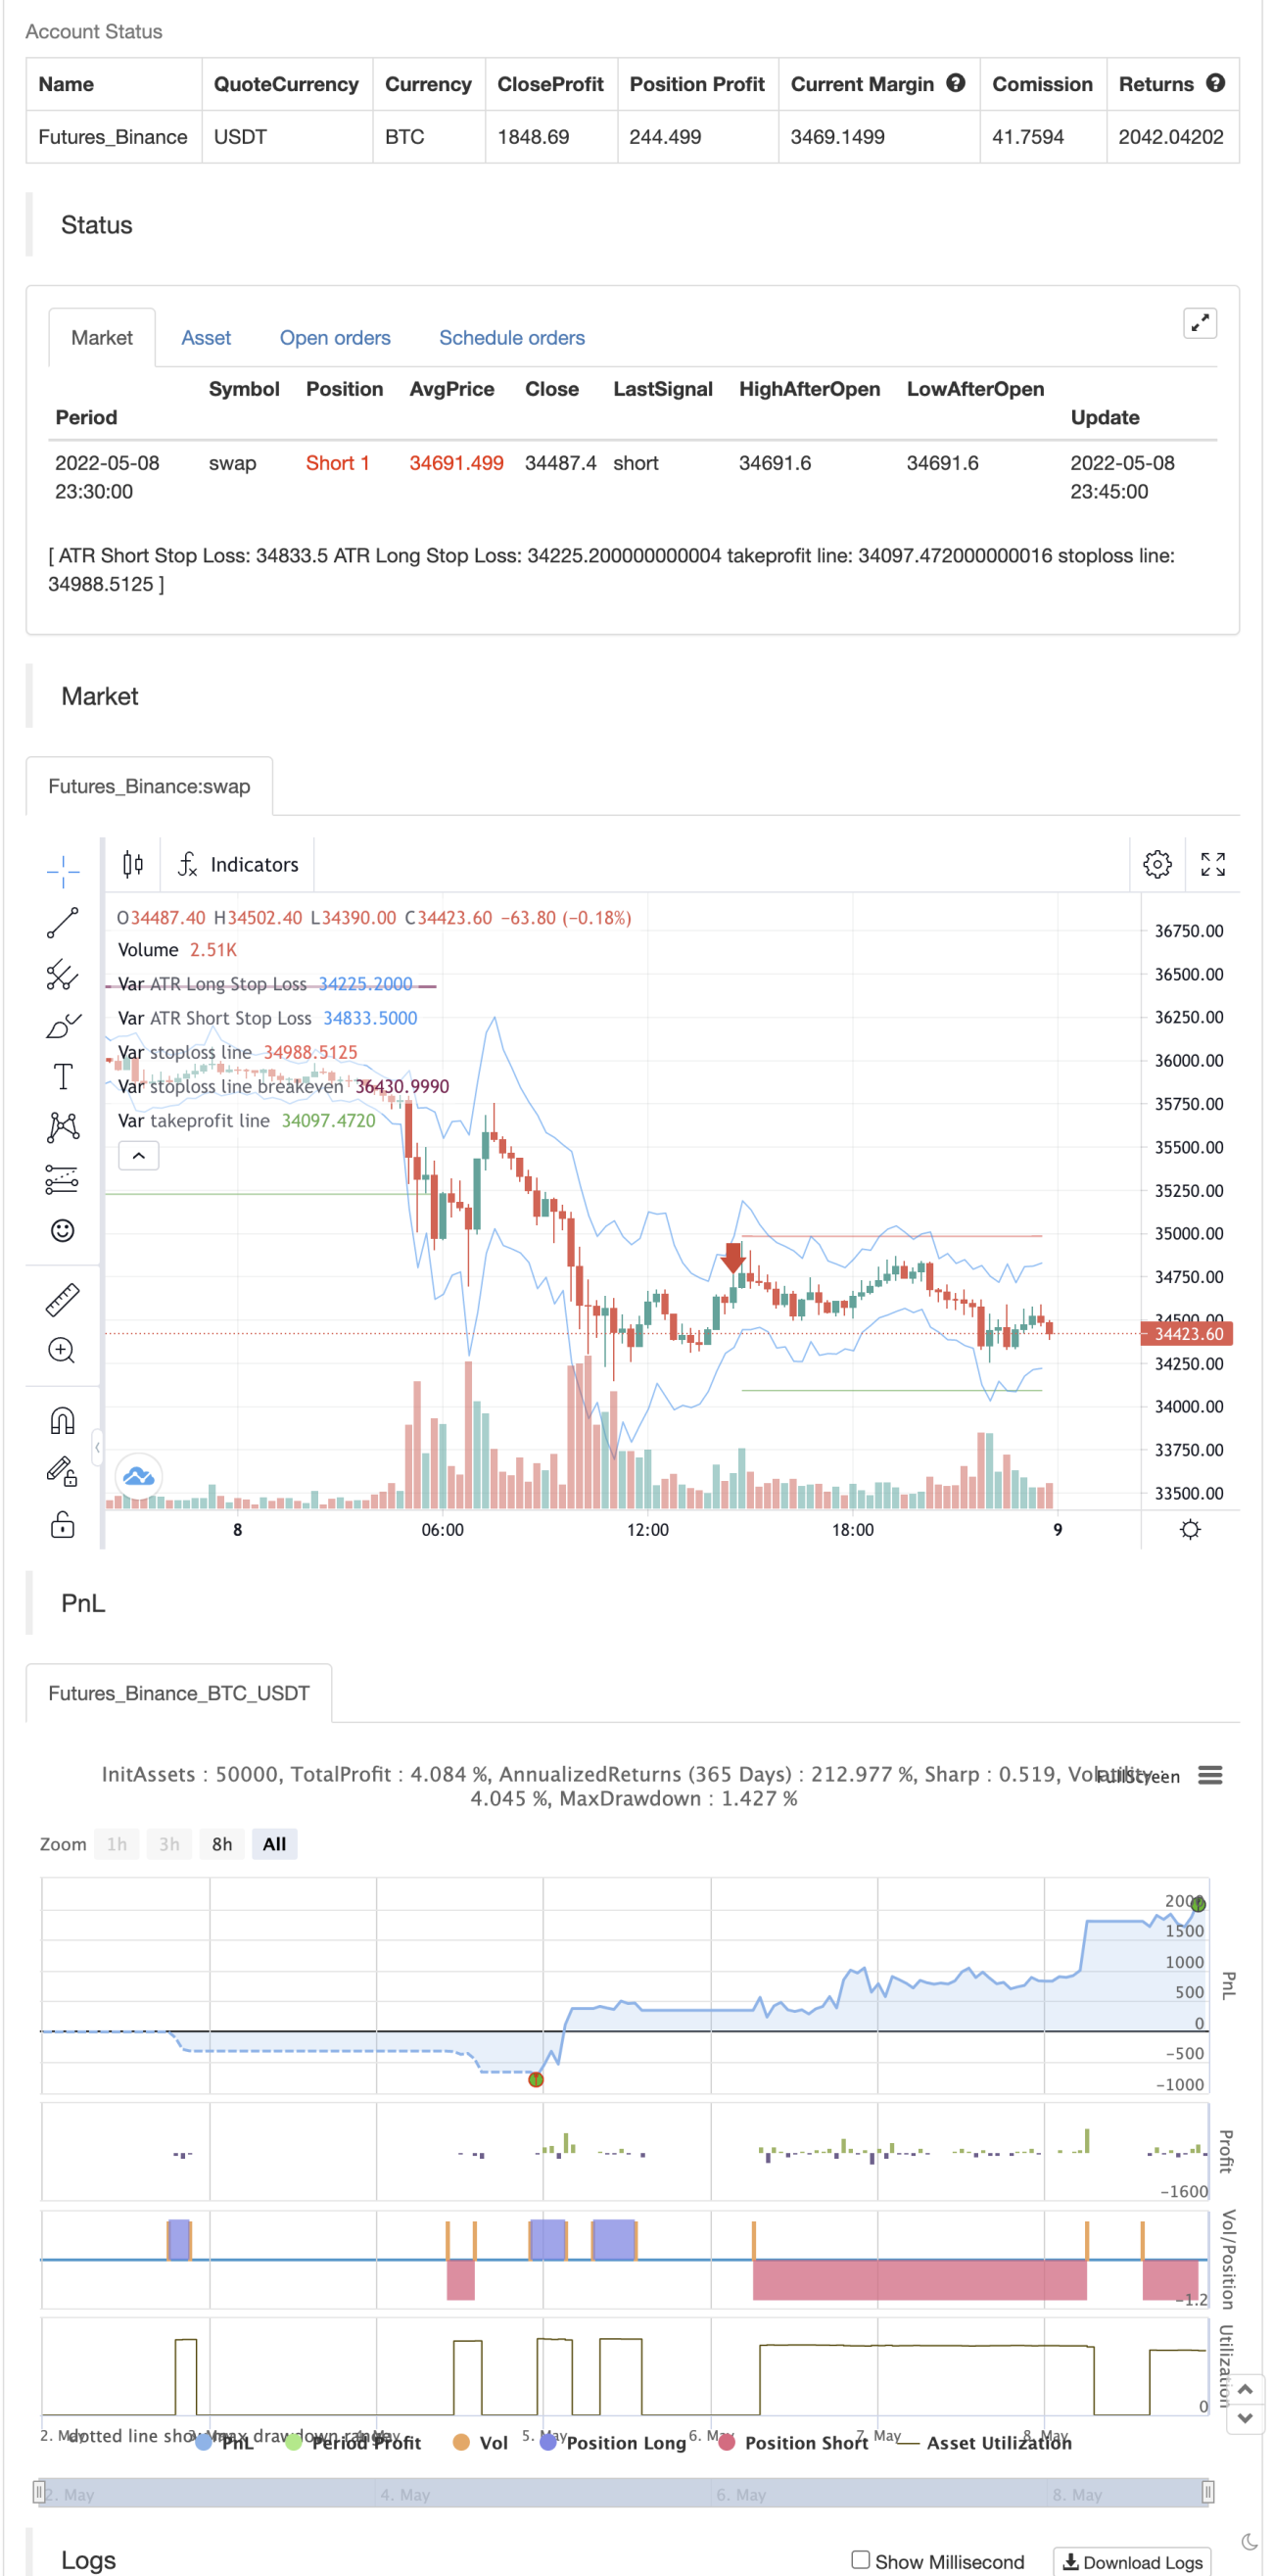
This strategy combines Supertrend, 200 EMA , Stochastic , and an ATR stop loss indicator. For buy conditions, the Stochastic has to be below the 20 level, price has to be above the 200 Ema and the Supertrend has to be green. For sell conditions, it has to be the opposite. the Stochastic has to be above the 80 level, price has to be below the 200 Ema and the Supertrend has to be red.

backtest

img


// This source code is subject to the terms of the Mozilla Public License 2.0 at https://mozilla.org/MPL/2.0/
// © araamas

//@version=5
strategy("stoch supertrd atr 200ma", overlay=true, shorttitle="STOCH SUPTR ATR MA", process_orders_on_close=true, max_bars_back=5000)
 
ema_condition = input.bool(defval=true, title="ema needed?", tooltip="You can choose whether to include the Ema in the buy and sell conditions")    
atrPeriod = input(10, "ATR Length")
factor = input.float(3.0, "Factor", step = 0.01)

[supertrend, direction] = ta.supertrend(factor, atrPeriod)

// bodyMiddle = plot((open + close) / 2, display=display.none)
// upTrend = plot(direction < 0 ? supertrend : na, "Up Trend", color = color.green, style=plot.style_linebr)
// downTrend = plot(direction < 0? na : supertrend, "Down Trend", color = color.red, style=plot.style_linebr)

period = input.int(defval=200, title="ema period")
ema = ta.ema(close, period)
// plot(ema, title="200 ema", color=color.yellow)

b = input.int(defval=14, title="length k%")
d = input.int(defval=3, title="smoothing k%")
s = input.int(defval=3, title="smoothing d%")
smooth_k = ta.sma(ta.stoch(close, high, low, b), d)
smooth_d = ta.sma(smooth_k, s)

////////////////////////////////////////////////////////////////////////////////
length = input.int(title="Length", defval=12, minval=1)
smoothing = input.string(title="Smoothing", defval="SMA", options=["RMA", "SMA", "EMA", "WMA"])
m = input(1.5, "Multiplier")
src1 = input(high)
src2 = input(low)
pline = input(true, "Show Price Lines")
col1 = input(color.blue, "ATR Text Color")
col2 = input(color.teal, "Low Text Color",inline ="1")
col3 = input(color.red, "High Text Color",inline ="2")

collong = input(color.teal, "Low Line Color",inline ="1")
colshort = input(color.red, "High Line Color",inline ="2")

ma_function(source, length) =>
	if smoothing == "RMA"
		ta.rma(source, length)
	else
		if smoothing == "SMA"
			ta.sma(source, length)
		else
			if smoothing == "EMA"
				ta.ema(source, length)
			else
				ta.wma(source, length)
				
a = ma_function(ta.tr(true), length) * m
x = ma_function(ta.tr(true), length) * m + src1
x2 = src2 - ma_function(ta.tr(true), length) * m

p1 = plot(x, title = "ATR Short Stop Loss", color=color.blue)
p2 = plot(x2, title = "ATR Long Stop Loss", color= color.blue)


///////////////////////////////////////////////////////////////////////////////////////////////

shortCondition = high < ema and direction == 1 and smooth_k > 80 or (ema_condition == false and direction == 1 and smooth_k > 80)
if (shortCondition) and strategy.position_size == 0
    strategy.entry("sell", strategy.short)

longCondition = low > ema and direction == -1 and smooth_k < 20 or (ema_condition == false and direction == -1 and smooth_k < 20)
if (longCondition) and strategy.position_size == 0
    strategy.entry("buy", strategy.long)

x2_val = x2[bar_index - strategy.opentrades.entry_bar_index(0)]
g = (strategy.opentrades.entry_price(0) - x2_val) * 2 // tp for buy

x_val = x[bar_index - strategy.opentrades.entry_bar_index(0)]
k = (x_val - strategy.opentrades.entry_price(0)) * 2 //tp for sell

activate_breakeven_sl_price = strategy.opentrades.entry_price(0) + (strategy.opentrades.entry_price(0) - x2_val) //price to activate sl for buy
sl_breakeven_price_activated = ta.highest(high, strategy.position_size == 0 ? nz(strategy.opentrades.entry_bar_index(0), 1):bar_index - strategy.opentrades.entry_bar_index(0)) > activate_breakeven_sl_price ? true:false //checks if 1:1 ratio has been reached

activate_breakeven_sl_price1 = strategy.opentrades.entry_price(0) - (x_val - strategy.opentrades.entry_price(0)) //price to activate sl for buy
sl_breakeven_price_activated1 = ta.lowest(high, strategy.position_size == 0 ? nz(strategy.opentrades.entry_bar_index(0), 1):bar_index - strategy.opentrades.entry_bar_index(0)) < activate_breakeven_sl_price1 ? true:false //checks if 1:1 ratio has been reached

if strategy.position_size > 0
    strategy.exit(id="buy exit", from_entry="buy",limit=strategy.opentrades.entry_price(0) + g, stop=sl_breakeven_price_activated ? strategy.opentrades.entry_price(0):x2_val) 

if strategy.position_size < 0
    strategy.exit(id="sell exit", from_entry="sell",limit=strategy.opentrades.entry_price(0) - k, stop=sl_breakeven_price_activated1 ? strategy.opentrades.entry_price(0):x_val) 


plot(strategy.position_size > 0 ? strategy.opentrades.entry_price(0) + g:na, color=color.green, style=plot.style_linebr, title="takeprofit line") //to plot tp line for buy
plot(strategy.position_size > 0 and sl_breakeven_price_activated == false ? x2_val:na, color=color.red, style=plot.style_linebr, title="stoploss line") //to plot sl line for buy
plot(sl_breakeven_price_activated and strategy.position_size > 0 ? strategy.opentrades.entry_price(0):na, color=color.maroon, style=plot.style_linebr, linewidth=2, title="stoploss line breakeven") //to plot breakeven sl for buy

plot(strategy.position_size < 0 ? strategy.opentrades.entry_price(0) - k:na, color=color.green, style=plot.style_linebr, title="takeprofit line") //to plot tp line for sell
plot(strategy.position_size < 0 and sl_breakeven_price_activated1 == false ? x_val:na, color=color.red, style=plot.style_linebr, title="stoploss line") //to plot sl line for sell
plot(sl_breakeven_price_activated1 and strategy.position_size < 0 ? strategy.opentrades.entry_price(0):na, color=color.maroon, style=plot.style_linebr, linewidth=2, title="stoploss line breakeven") //to plot breakeven sl for sell


Related

More