Moving Average Colored EMA/SMA

1
Follow
1802
Followers
Amazon Prime Video presents Garaj Garaj Jugalbandi Video Song from Bandish Bandits. A folk song performed by Ritwik Bhowmik and Atul Kulkarni, sung by Farid Hasan & Mohammed Aman, music directed by Shankar Ehsaan Loy and lyrics by Sameer Samant. In the season finale Radhe and Digvijay repeat this song as an ode to their common teacher, Panditji.
backtest
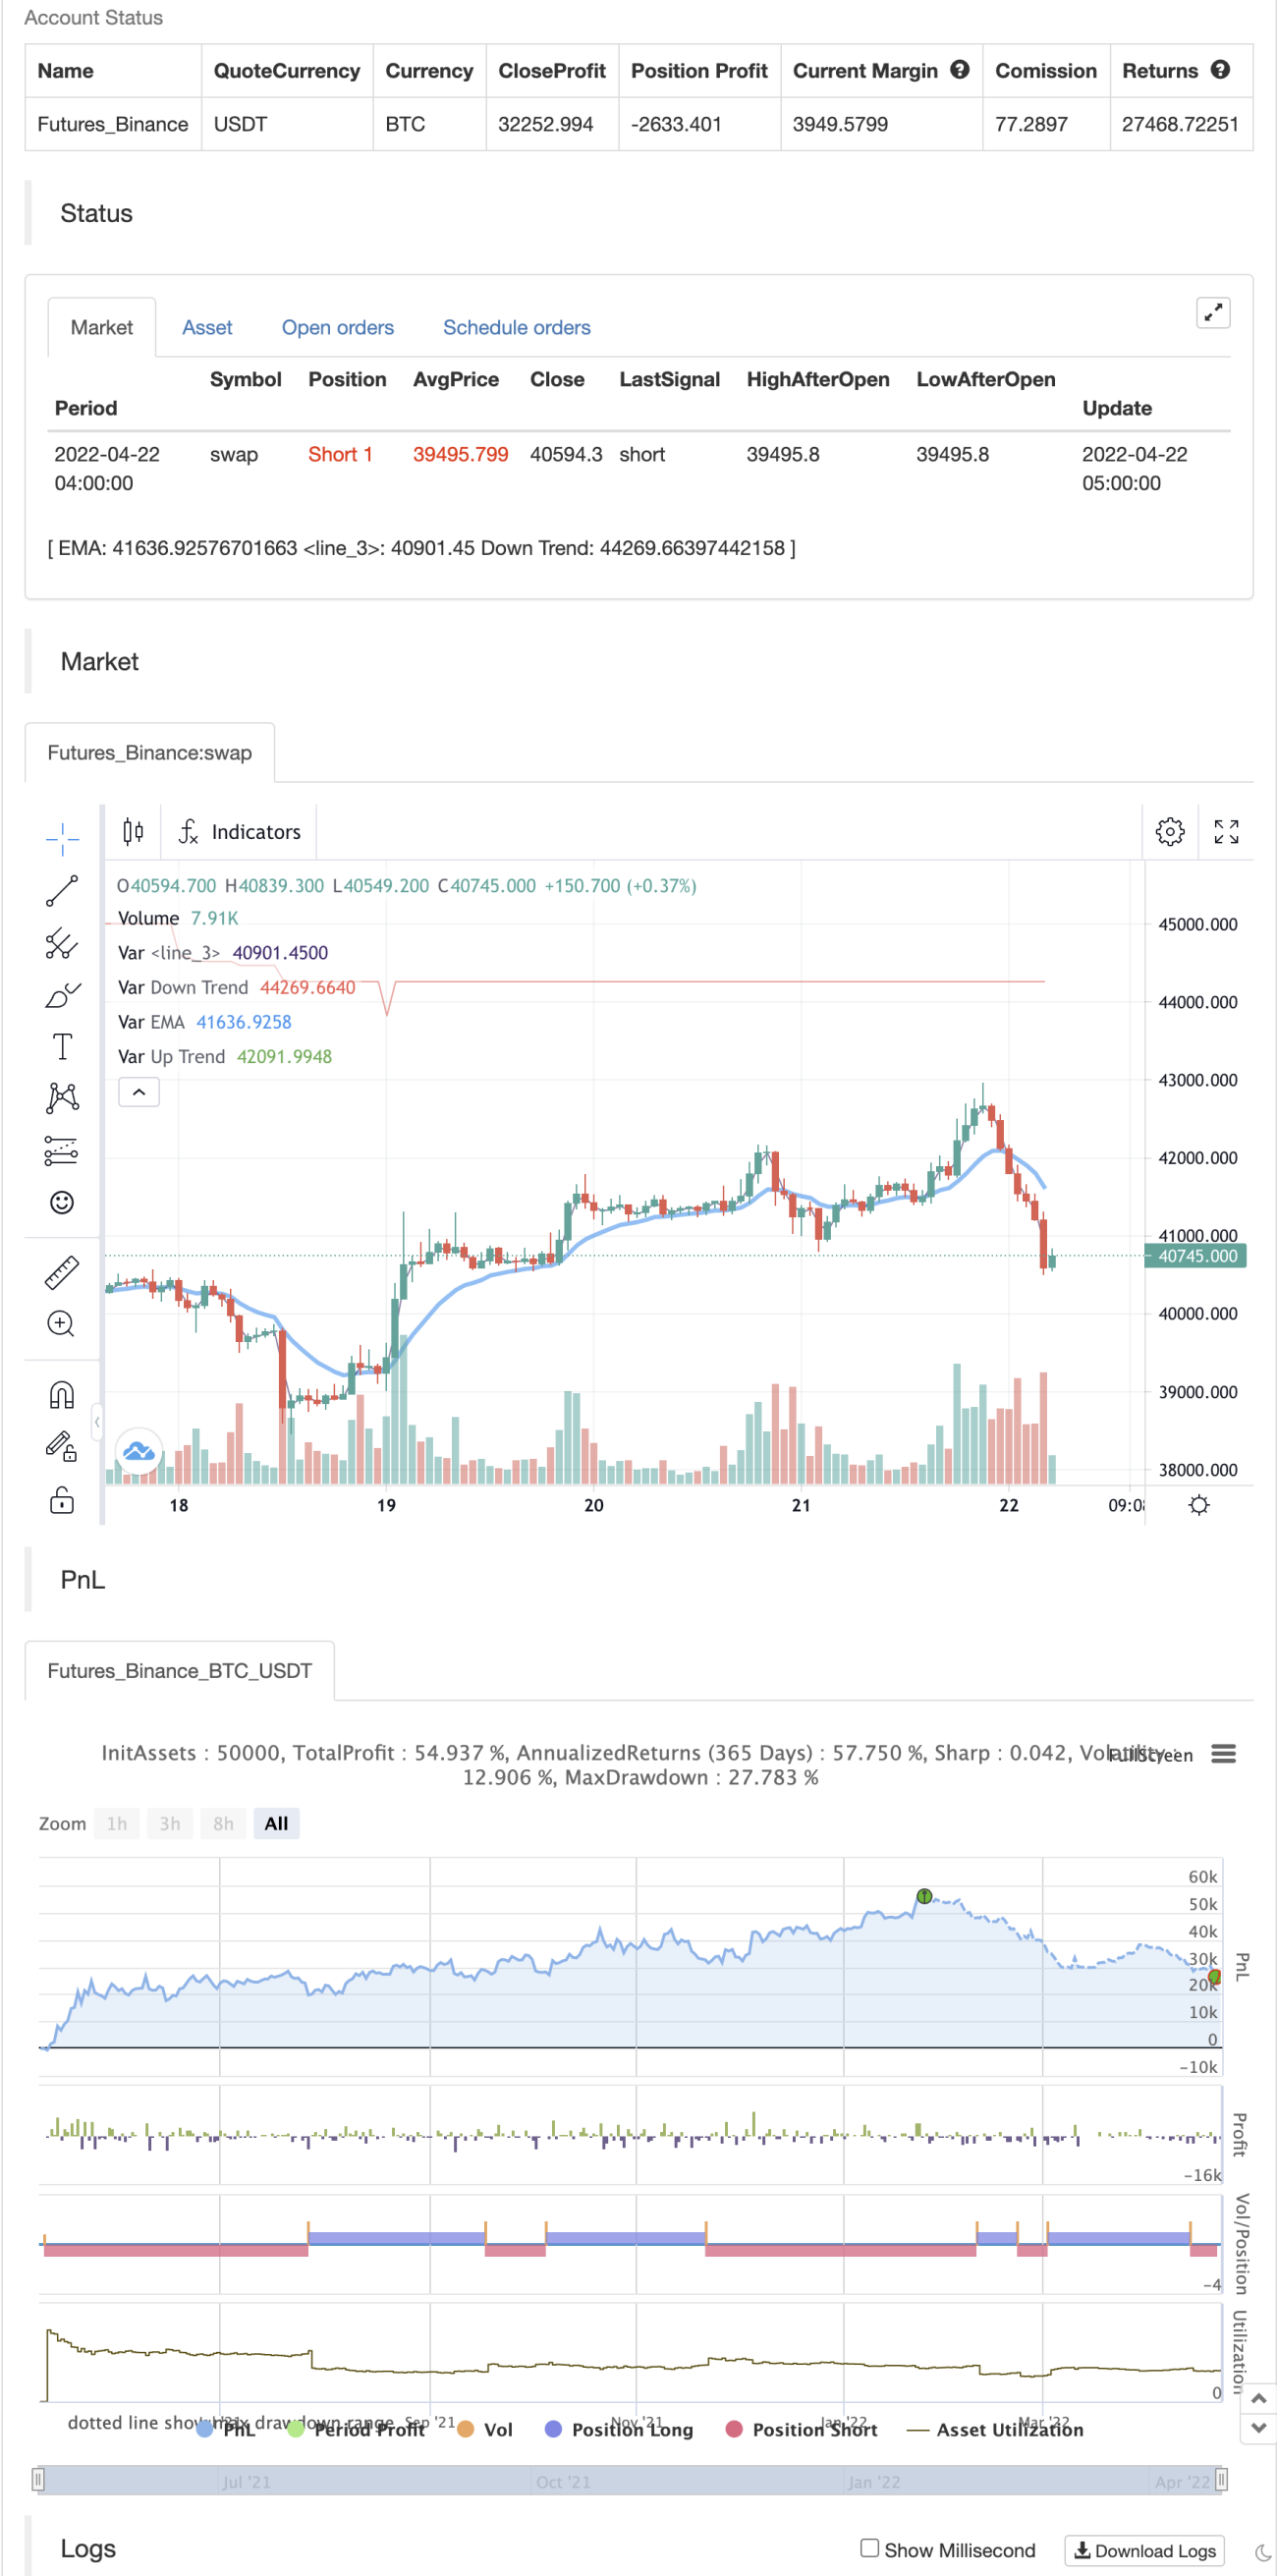
Source
Pine
Strategy parameters
Related strategies
Comment
All comments (0)
No data
- 1