
1
Follow
1802
Followers
USe for buy sell signals
Use settings 100,3
backtest
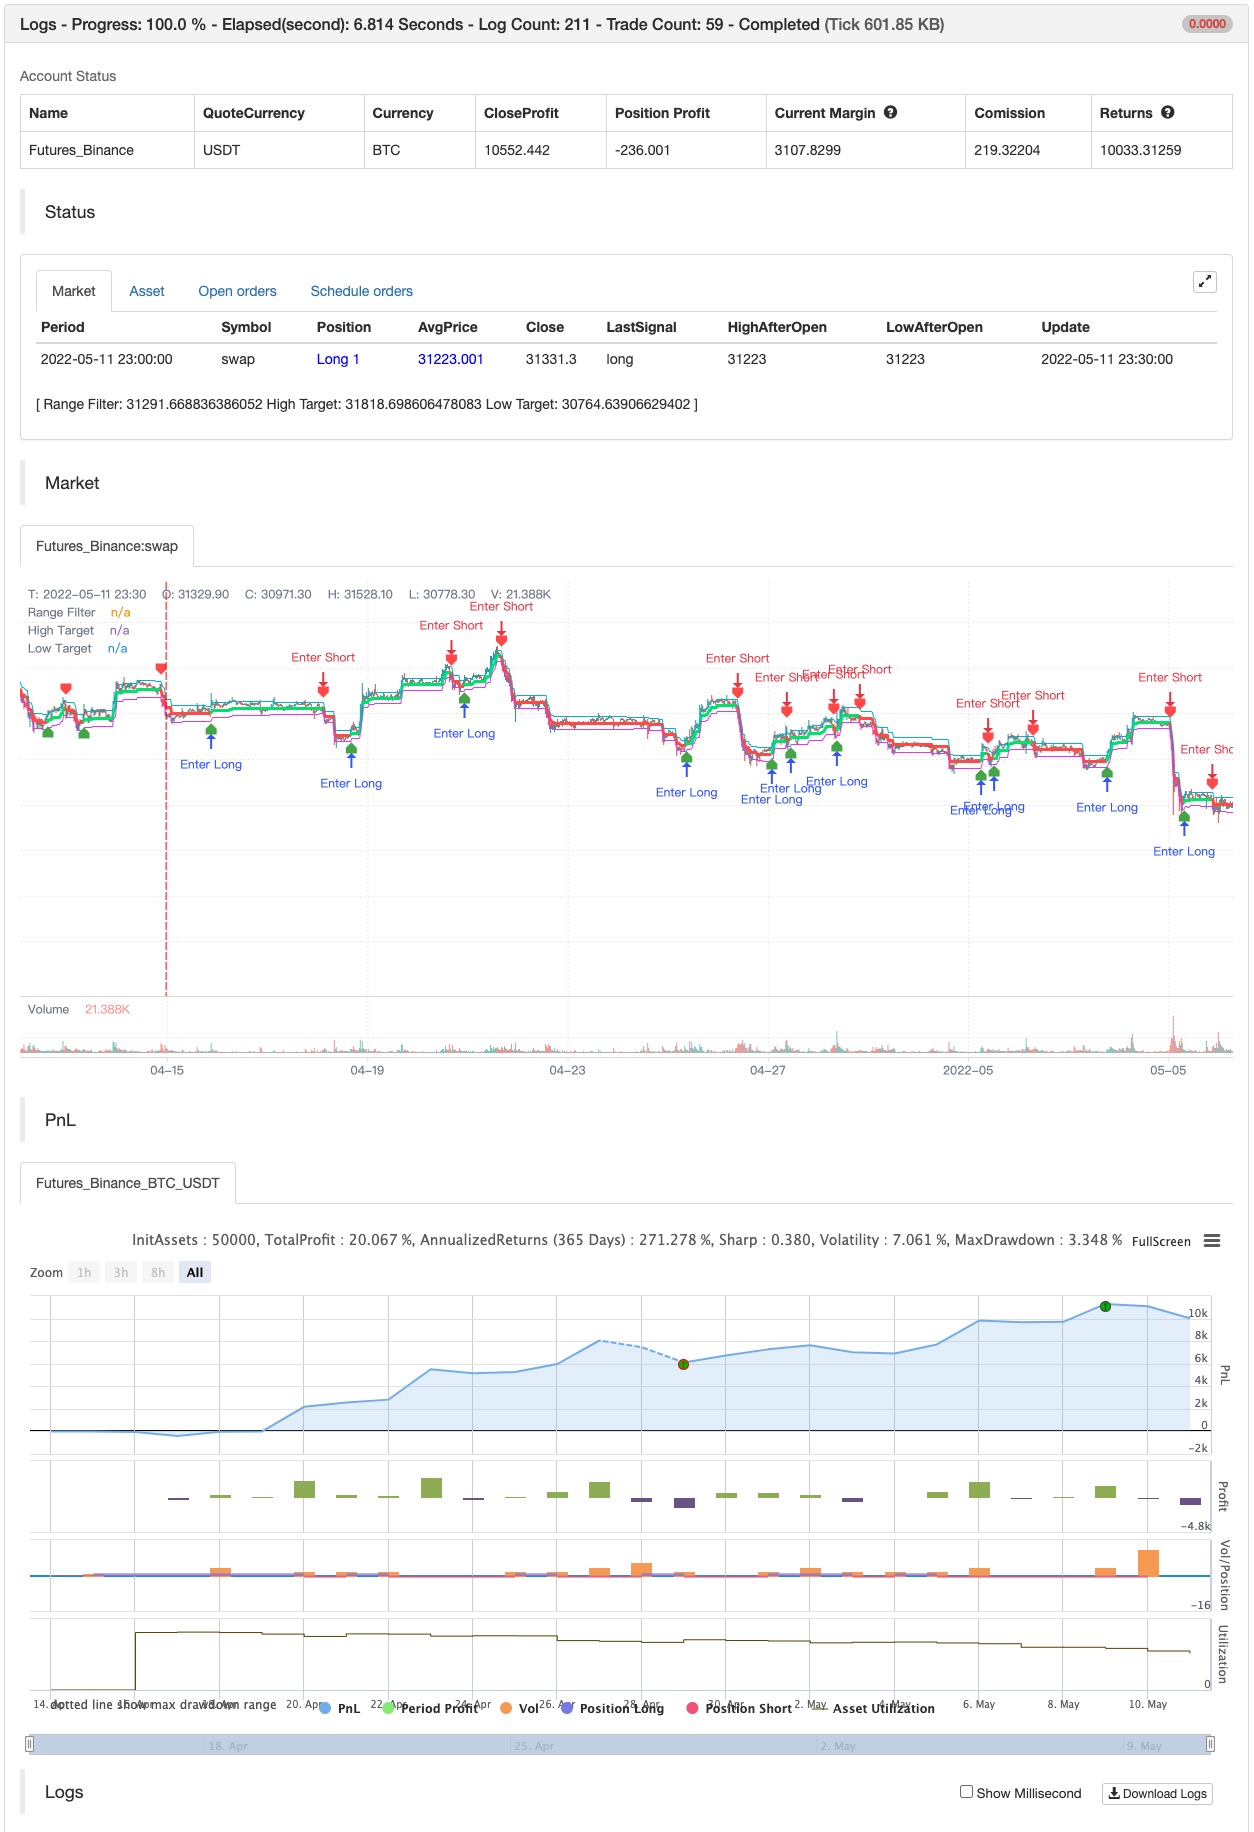
Source
Pine
/*backtest
start: 2022-04-15 00:00:00
end: 2022-05-11 23:59:00
period: 30m
basePeriod: 15m
exchanges: [{"eid":"Futures_Binance","currency":"BTC_USDT"}]
*/

//@version=5
indicator(title='Sidboss', overlay=true)
src = input(defval=close, title='Source')
per = input.int(defval=100, minval=1, title='Sampling Period')Strategy parameters
Related strategies
Comment
All comments (0)
No data
- 1