Donchian Breakout no repaint

Author: ChaoZhang, Date: 2022-05-18 11:33:27
Tags: EMA

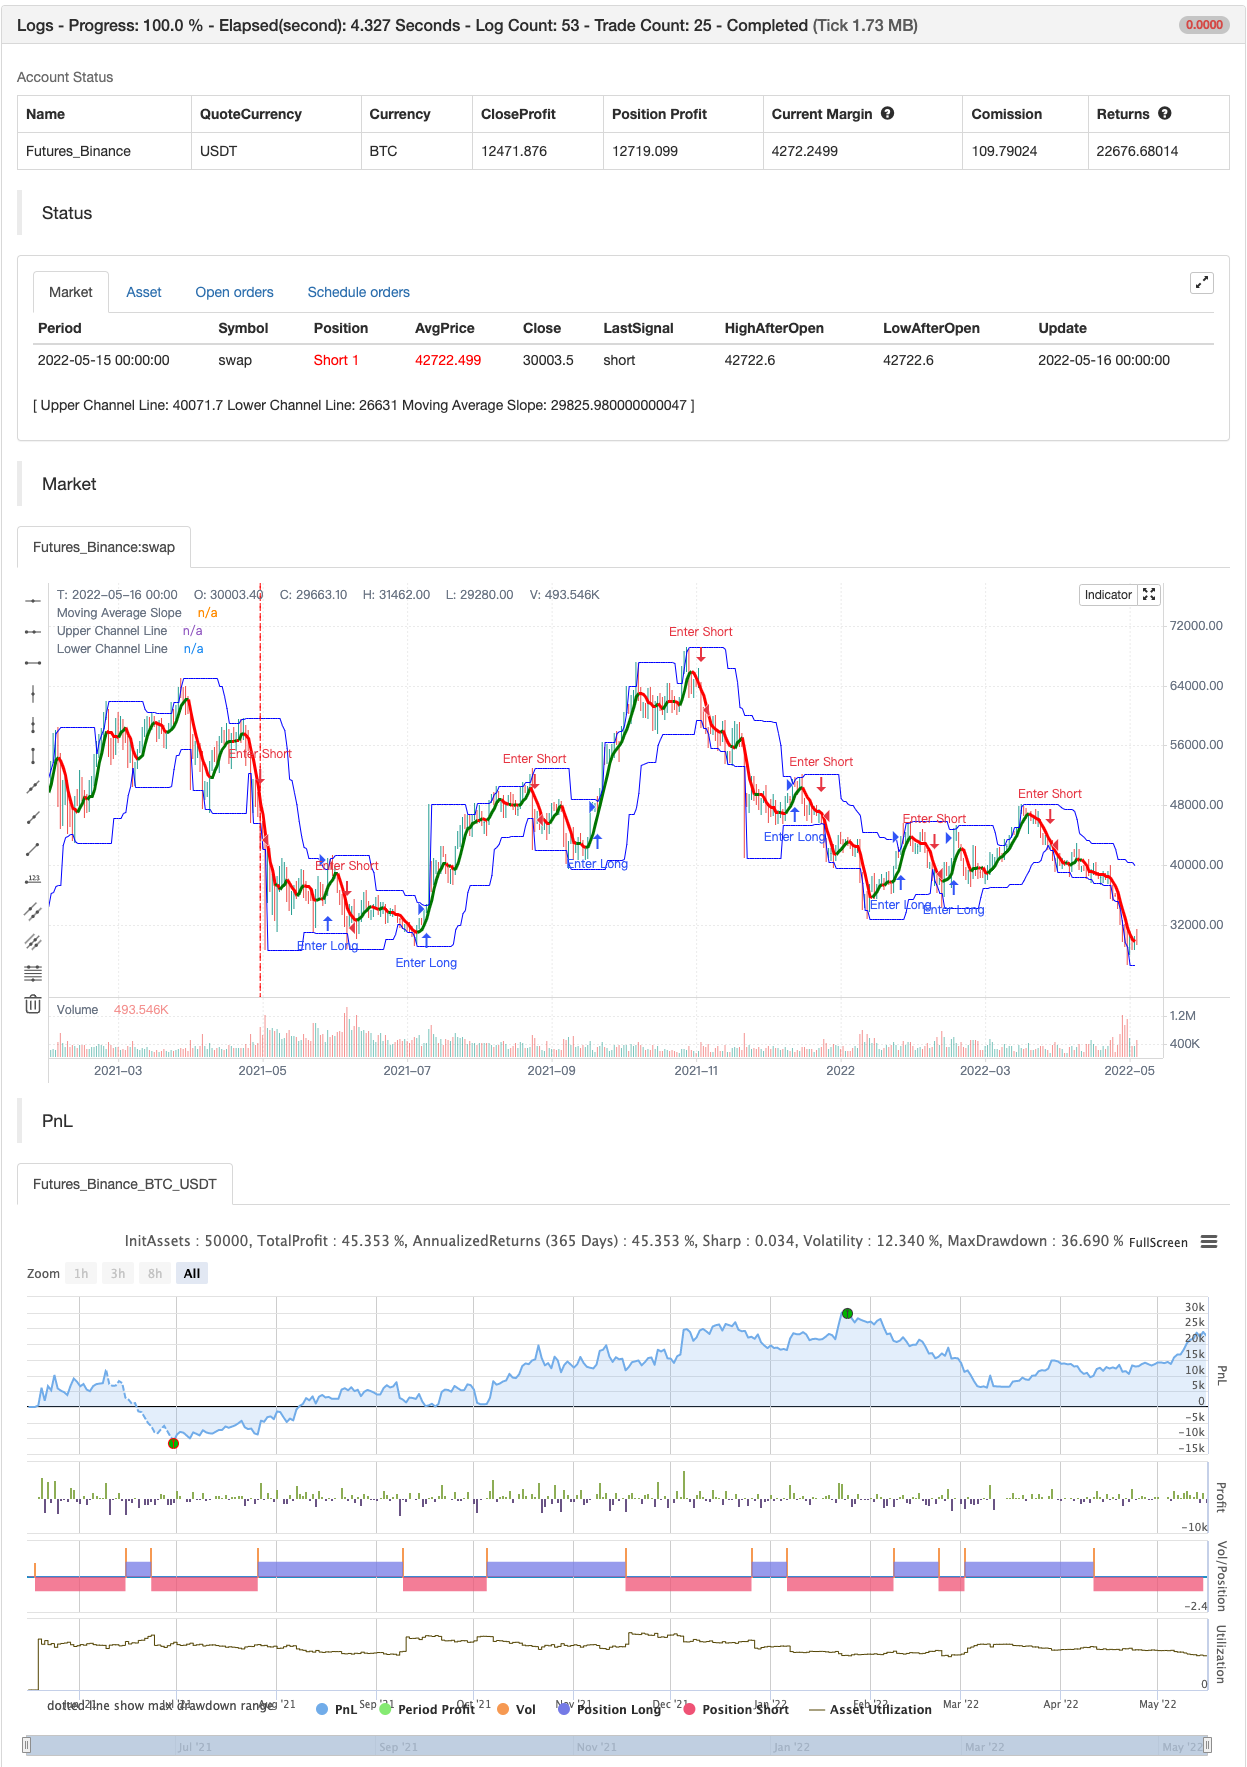
donchian breakout strategy which i revise the script for no repaint signal

backtest

img


/*backtest
start: 2021-05-17 00:00:00
end: 2022-05-16 23:59:00
period: 1d
basePeriod: 1h
exchanges: [{"eid":"Futures_Binance","currency":"BTC_USDT"}]
*/

//@version=5

// Revision:        3
// Author:          @millerrh
// Strategy:  
//      Entry: Buy when Donchian Channel breaks out
//      Exit: Trail a stop with the lower Donchian Channel band. 
// Conditions/Variables:
//    1. Can add a filter to only take setups that are above a user-defined moving average on current timeframe and/or longer timeframe (helps avoid trading counter trend) 
//    2. Manually configure which dates to back test
//    3. User-Configurable DC Channel length, with independent settings for top and bottom (Similar to Jessee Livermore Trading System where he used 150/50)
//    4. ADR (average of 21 days) added to a table as well as the percentage between the two bands.  Ability to filter out trades with stops wider than a % of the ADR for better Risk/Reward setups.
//    5. Optionally use a tighter lower DC Channel for your initial stop.  Once in profit, trail with wider DC channel to give more breathing room.

strategy('Rev Donchian Breakout', overlay=true, initial_capital=100000, currency='USD', default_qty_type=strategy.percent_of_equity, calc_on_every_tick = true,
  default_qty_value=100, commission_type=strategy.commission.percent, commission_value=0.1)

// === BACKTEST RANGE ===

// == INPUTS ==
// Donchian Channel Inputs
dcPeriodHigh = input.int(title="Upper Band:    Period", defval=15, group = "donchian inputs", inline = "upper",
  tooltip = "Lookback period and color for the high price boundary.")
upperColor = input(color.new(color.blue, 10), title = " Color", group = "donchian inputs", inline = "upper")
dcPeriodLow = input.int(title="Lower Band:    Period", defval=15, group = "donchian inputs", inline = "lower",
  tooltip = "Lookback period and color for the low price boundary.")
lowerColor = input(color.new(color.blue, 10), title = " Color", group = "donchian inputs", inline = "lower")
fillColor = input(color.new(color.gray, 90), title = "Fill Color", group = "donchian inputs",
  tooltip = "Adjust the color of the fill between the two main Donchian Channels.")
useTightStop = input.bool(title='Use a Tighter Channel for Initial Stop?', defval=false, group = "donchian inputs",
  tooltip = "'Keep your losers small and let winners run' is the saying.  This will allow you to use a tight initial stop 
  and then let it run once in profit with the looser stop of the wider main channel.")
dcPeriod2Low = input.int(title="Initial Stop:    Period", defval=8, group = "donchian inputs", inline = "tight",
  tooltip = "Lookback period and color for the initial stop level when using a tighter initial stop.")
tightColor = input(color.new(color.orange, 10), title = " Color", group = "donchian inputs", inline = "tight")
trigInput = input.string(title='Execute Trades On...', defval='Wick', options=['Wick', 'Close'], group = "donchian inputs",
  tooltip = "Useful for comparing standing stop orders at the Donchian channel boundary (executing on the wick) vs. waiting for candle closes prior to taking action")

// Moving Average Filtering Inputs
useMaFilterSlope = input.bool(title='Use Rising/Falling Moving Average as Filter?', defval=true, group = "moving average filtering")
tfSetSlope = input.timeframe(defval="D", title="Timeframe of Moving Average", group = "moving average filtering",
  tooltip = "Allows you to set a different time frame for a moving average filter.  Trades will be ignored when this moving average is declining.
  The idea is to keep your eye on the larger moves in the market and stay on the right side of the longer term trends and help you be pickier about 
  the stocks you trade.")
maSlopeType = input.string(defval='SMA', options=['EMA', 'SMA'], title='MA Type For Filtering', group = "moving average filtering")
maSlopeLength = input.int(defval=5, title="Moving Average:    Length", minval=1, group = "moving average filtering", inline = "slope")
maSlopeColorR = input(color.new(color.green, 50), title = " Rising", group = "moving average filtering", inline = "slope")
maSlopeColorF = input(color.new(color.red, 50), title = " Falling", group = "moving average filtering", inline = "slope")
useMaFilter = input.bool(title='Use Moving Average for Filtering (Current Timeframe)?', defval=false, group = "moving average filtering",
  tooltip = "Signals will be ignored when price is under this moving average.  The intent is to keep you out of bear periods and only buying when 
             price is showing strength.")
maType = input.string(defval='SMA', options=['EMA', 'SMA'], title='MA Type For Filtering', group = "moving average filtering")
maLength = input.int(defval=50, title="Moving Average:    Length", minval=1, group = "moving average filtering", inline = "1ma")
ma1Color = input(color.new(color.green, 50), title = " Color", group = "moving average filtering", inline = "1ma")
useMaFilter2 = input.bool(title='Use Moving Average for Filtering (High Timeframe)?', defval=false, group = "moving average filtering")
tfSet = input.timeframe(defval="D", title="Timeframe of Moving Average", group = "moving average filtering",
  tooltip = "Allows you to set a different time frame for a moving average filter.  Trades will be ignored when price is under this moving average.
  The idea is to keep your eye on the larger moves in the market and stay on the right side of the longer term trends and help you be pickier about 
  the stocks you trade.")
ma2Type = input.string(defval='SMA', options=['EMA', 'SMA'], title='MA Type For Filtering', group = "moving average filtering")
ma2Length = input.int(defval=50, title="Moving Average:    Length", minval=1, group = "moving average filtering", inline = "2ma")
ma2Color = input(color.new(color.white, 50), title = " Color", group = "moving average filtering", inline = "2ma")

// ADR Filtering - The idea here is that you want to buy in a consolodating range for best risk/reward. So here you can compare the current distance between 
// support/resistance vs. the ADR and make sure you aren't buying at a point that is too extended.
useAdrFilter = input.bool(title = "Use ADR for Filtering?", defval = false, group = "adr filtering",
  tooltip = "Signals will be ignored if the distance between support and resistance is larger than a user-defined percentage of ADR (or monthly volatility
  in the stock screener). This allows the user to ensure they are not buying something that is too extended and instead focus on names that are consolidating more.")
adrPerc = input.int(defval = 120, title = "% of ADR Value", minval = 1, group = "adr filtering")
tableLocation = input.string(defval="Bottom", options=["Top", "Bottom"], title = "ADR Table Visibility", group = "adr filtering",
  tooltip = "Place ADR table on the top of the pane or the bottom of the pane.")
adrValue = request.security(syminfo.tickerid, "D", ta.sma((high-low)/math.abs(low) * 100, 21), barmerge.gaps_off, barmerge.lookahead_on) // Monthly Volatility in Stock Screener (also ADR)
adrCompare = (adrPerc * adrValue) / 100

// === THE DONCHIAN CHANNEL ===
// Logic
dcUpper = ta.highest(high, dcPeriodHigh)[1]
dcLower = ta.lowest(low, dcPeriodLow)[1]
dcStop = ta.lowest(low, dcPeriod2Low)[1]
dcMid = math.avg(dcUpper, dcLower)[1]

// Plotting
dcUplot = plot(dcUpper, color=upperColor, linewidth=1, title='Upper Channel Line')
dcSplot = plot(useTightStop ? dcStop : na, color=tightColor, linewidth=1, title='Initial Stop Channel Line')
dcLplot = plot(dcLower, color=lowerColor, linewidth=1, title='Lower Channel Line')
// dcMidPlot = plot(dcMid, color=color.new(color.gray, 10), linewidth=1, title='Mid-Line Average')
fill(dcUplot, dcLplot, color=fillColor)

// == FILTERING LOGIC ==
// Declare function to be able to swap out EMA/SMA
ma(maType, src, length) =>
    maType == 'EMA' ? ta.ema(src, length) : ta.sma(src, length)  //Ternary Operator (if maType equals EMA, then do ema calc, else do sma calc)
maSlope = request.security(syminfo.tickerid, tfSetSlope, ma(maSlopeType, close, maSlopeLength), barmerge.gaps_off, barmerge.lookahead_on)
maFilter = ma(maType, close, maLength)
maFilter2 = request.security(syminfo.tickerid, tfSet, ma(ma2Type, close, ma2Length), barmerge.gaps_off, barmerge.lookahead_on)

maRising = request.security(syminfo.tickerid, tfSetSlope, (ta.rising(maSlope, 1)), barmerge.gaps_off, barmerge.lookahead_on)
maCol = maRising ? maSlopeColorR : maSlopeColorF
plot(useMaFilter ? maFilter : na, title='Trend Filter MA - CTF', color=ma1Color, linewidth=2, style=plot.style_line)
plot(useMaFilter2 ? maFilter2 : na, title='Trend Filter MA - HTF', color=ma2Color, linewidth=2, style=plot.style_line)
plot(useMaFilterSlope ? maSlope : na, title='Moving Average Slope', color=maCol, linewidth=3, style=plot.style_line)

// == ADR TABLE ==

//var table adrTable = table.new("tablePos", 2, 1, border_width = 3)
lightTransp = 90
avgTransp   = 80
heavyTransp = 70
posColor = color.rgb(38, 166, 154)
negColor = color.rgb(240, 83, 80)
volColor = color.new(#999999, 0)

f_fillCellVol(_table, _column, _row, _value) =>
    _transp = math.abs(_value) > 7 ? heavyTransp : math.abs(_value) > 4 ? avgTransp : lightTransp
    _cellText = str.tostring(_value, "0.00") + "%\n" + "ADR"
    table.cell(_table, _column, _row, _cellText, bgcolor = color.new(volColor, _transp), text_color = volColor, width = 6)

srDistance = (dcUpper[1] - dcLower[1])/dcUpper[1] * 100

f_fillCellCalc(_table, _column, _row, _value) =>
    _c_color = _value >= adrCompare ? negColor : posColor
    _transp = _value >= adrCompare*0.8 and _value <= adrCompare*1.2 ? lightTransp : 
      _value >= adrCompare*0.5 and _value < adrCompare*0.8 ? avgTransp :
      _value < adrCompare*0.5 ? heavyTransp :
      _value > adrCompare*1.2 and _value <= adrCompare*1.5 ? avgTransp :
      _value > adrCompare*1.5 ? heavyTransp : na
    _cellText = str.tostring(_value, "0.00") + "%\n" + "Range"
    table.cell(_table, _column, _row, _cellText, bgcolor = color.new(_c_color, _transp), text_color = _c_color, width = 6)


// == ENTRY AND EXIT CRITERIA ==
// Trigger stop based on candle close or High/Low (i.e. Wick) - If doing daily timeframe, can do candle close.  Intraday should use wick.
trigResistance = trigInput == 'Close' ? close : trigInput == 'Wick' ? high : na
trigSupport = trigInput == 'Close' ? close : trigInput == 'Wick' ? low : na
buySignal = trigResistance > dcUpper[1]  // The [1] looks at the previous bar's value as it didn't seem to be triggering correctly without it (likely) DC moves with each bar

buyConditions = (useMaFilter ? dcUpper[1] > maFilter : true) and
  (useMaFilter2 ? dcUpper[1] > maFilter2 : true) and
  (useAdrFilter ? srDistance < adrCompare : true) and
  (useMaFilterSlope ? maRising : true)
  
// == STOP AND PRICE LEVELS ==
// Configure initial stop level
inPosition = strategy.position_size > 0
inProfit = strategy.position_avg_price <= dcStop[1]
float stopLevel = na
stopLevel := inPosition and not inProfit ? dcStop[1] : inPosition and inProfit ? stopLevel[1] : dcStop[1] // Trail stop loss on dcStop line until in profit 

// Configure longer term trail stop
float trailStop = na
trailStop := inPosition and inProfit and (dcLower[1] > stopLevel) ? dcLower[1] : stopLevel
// Check if using near stop vs. not
stop = useTightStop ? trailStop : dcLower[1]
sellSignal = trigSupport < stop


if buySignal
    strategy.entry("Enter Long", strategy.long)
else if sellSignal
    strategy.entry("Enter Short", strategy.short)

Related

More