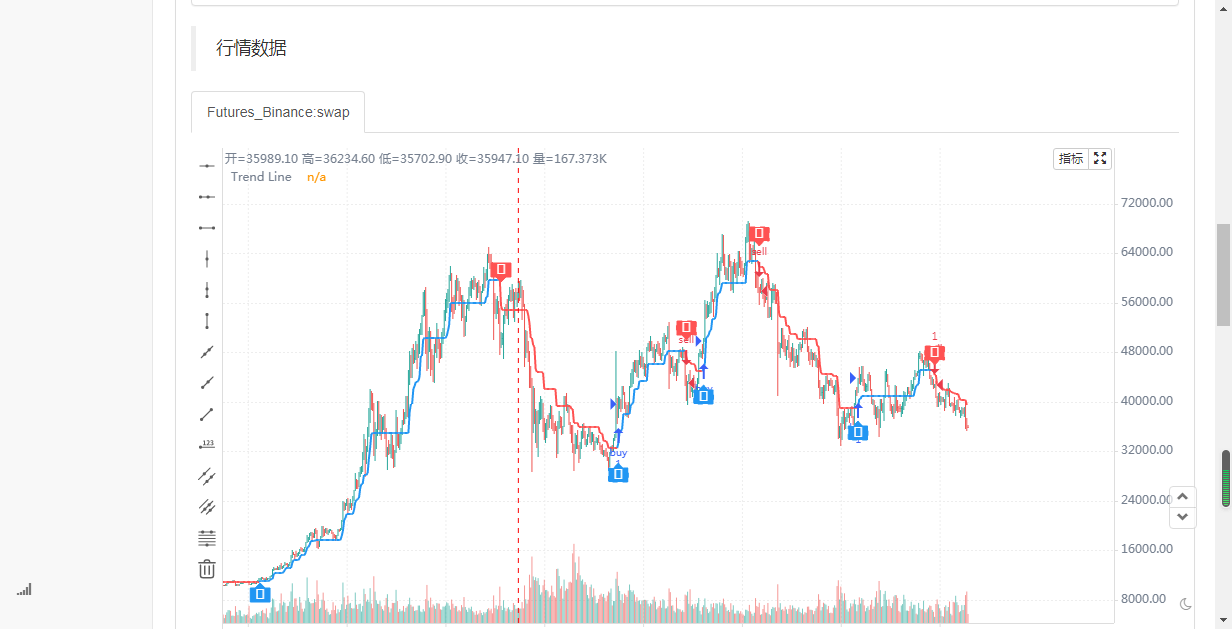
Follow Line Indicator

35
Follow
60
Followers
Source
Pine
/*backtest
start: 2021-05-08 00:00:00
end: 2022-05-07 23:59:00
period: 4h
basePeriod: 15m
exchanges: [{"eid":"Futures_Binance","currency":"BTC_USDT"}]
*/
// © Dreadblitz
//@version=4
study(shorttitle="FLI", title="Follow Line Indicator", overlay=true)
//
BBperiod      = input(defval = 21,     title = "BB Period",    type = input.integer, minval = 1)
Strategy parameters
Related strategies
Comment
All comments (0)
No data
- 1