KDJ Trending View with Signals and MA Strategy

Overview
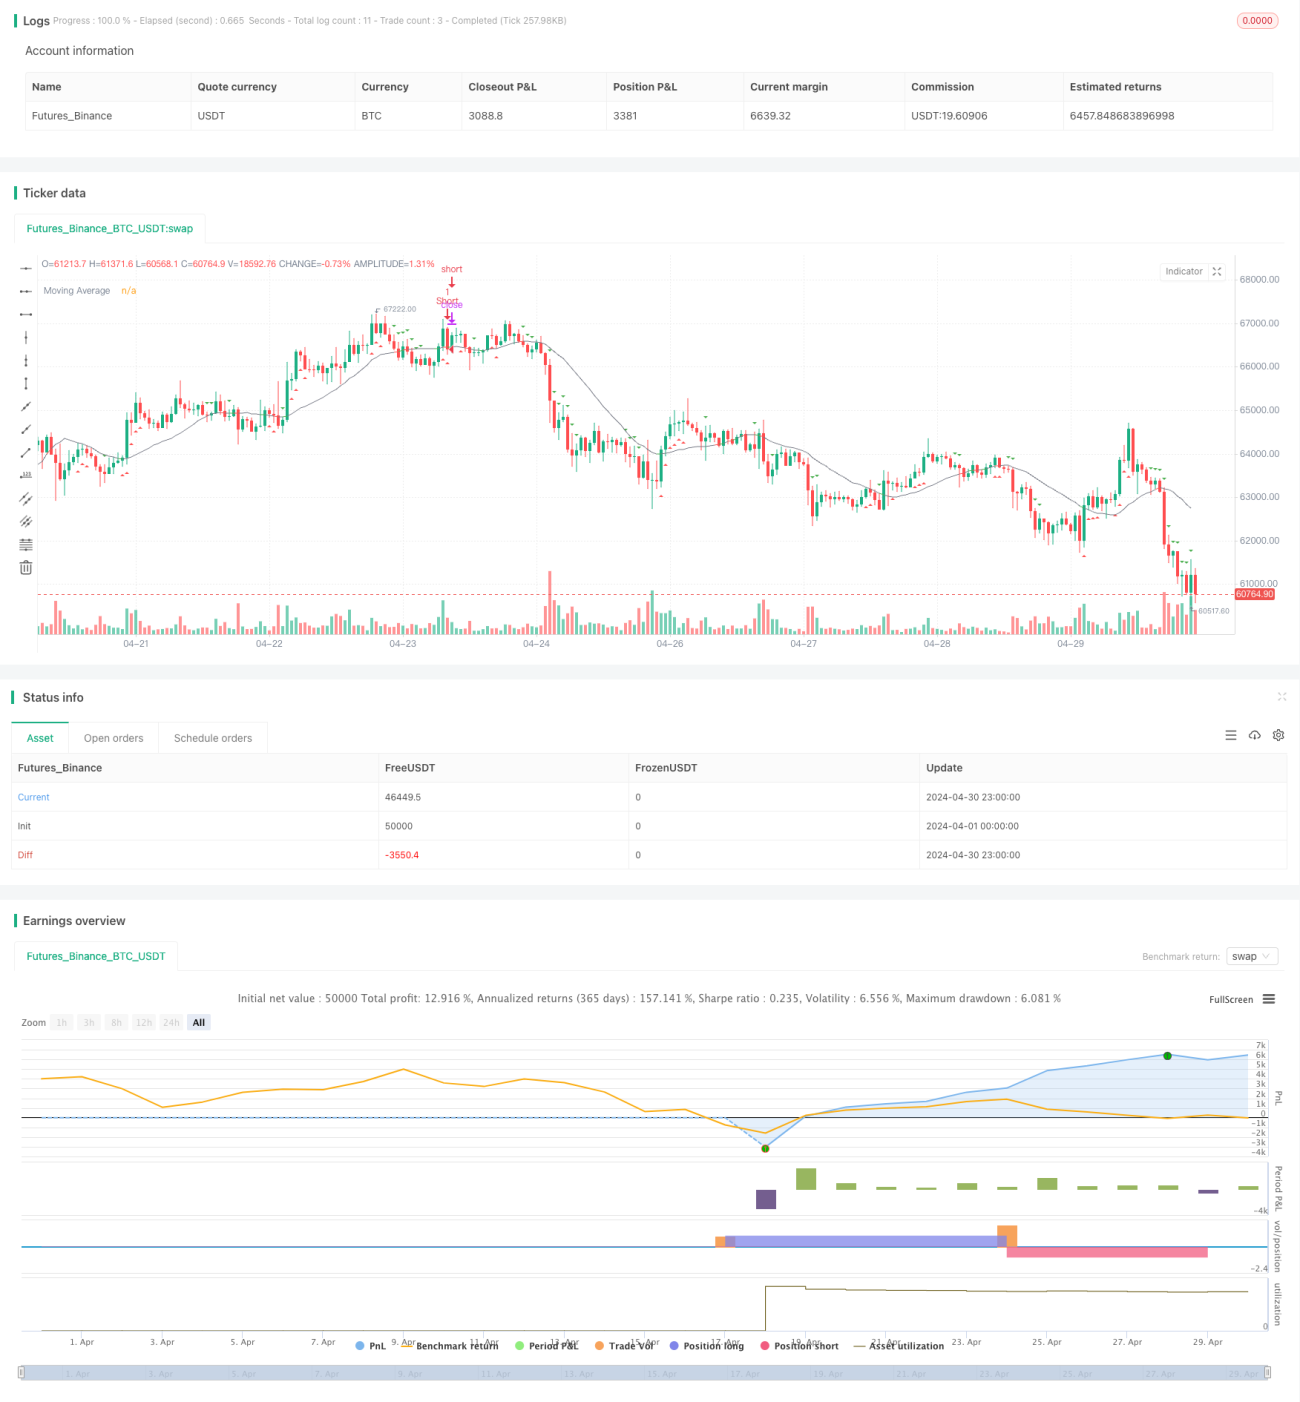
This strategy utilizes the KDJ indicator and Moving Average (MA) to identify market trends and generate trading signals. When the KDJ indicator exceeds the overbought level and the price breaks below the MA, a short signal is generated; when the KDJ indicator is below the oversold level and the price breaks above the MA, a long signal is generated. By combining the KDJ indicator with MA trend confirmation, this strategy can better capture market trends while avoiding false signals in ranging markets.
Strategy Principles
- Calculate the K, D, and J values of the KDJ indicator, where K is the N-day moving average of RSV, D is the M-day moving average of K, and J is calculated by the formula "3K-2D".
- Calculate the Moving Average (MA) to determine the current price trend.
- Determine the direction of the MA, with a bullish signal when the price crosses above and a bearish signal when it crosses below.
- Generate a short signal when the J value of KDJ is greater than the overbought level and the price crosses below the MA; generate a long signal when the J value is less than the oversold level and the price crosses above the MA.
- Open fixed-size (1 unit) long or short positions based on the signals.
Advantages
- Considers both overbought/oversold conditions and trend direction, allowing for better trend capturing.
- Uses MA as trend confirmation to effectively filter out false signals from the KDJ indicator in ranging markets.
- Includes adjustable overbought/oversold thresholds, increasing the flexibility of the strategy.
- The color of the moving average line changes based on trend direction, providing intuitive trend recognition.
- Plots trading signals on the chart for easy observation and analysis of strategy performance.
Risks
- The KDJ indicator is sensitive to parameters, and performance may vary significantly under different settings, requiring optimization for different instruments and timeframes.
- In ranging markets, even with MA as trend confirmation, the strategy may still generate numerous false signals, leading to losses.
- Fixed position sizing does not consider risk management and may take on significant risk during high market volatility.
- The strategy lacks stop-loss and take-profit mechanisms, potentially missing profit opportunities or magnifying losses.
Optimization Directions
- Optimize the parameters of the KDJ indicator to find the best combination suitable for the current instrument and timeframe.
- Introduce additional technical indicators such as RSI, MACD, etc., to enrich trend judgment and signal filtering conditions, improving signal quality.
- Optimize position management by dynamically adjusting position size based on market volatility or account equity to control risk.
- Add stop-loss and take-profit logic to close positions when predefined conditions are met, reducing single losses and locking in profits.
- Backtest and optimize the strategy to find the best parameter combinations and market adaptability.
Summary
By combining the KDJ indicator with moving averages, this strategy can effectively capture market trends and generate trading signals. Reasonable utilization of overbought/oversold information and trend direction can lead to robust trading performance. However, there is still room for optimization, such as introducing more filtering conditions, dynamic position management, stop-loss and take-profit, etc., to further enhance the strategy's robustness and profitability. In practical application, the strategy needs to be fine-tuned and tested for different market environments and instruments to verify its effectiveness and applicability.
- 1