Automated Trading Strategy Based on RSI Overbought and Oversold Levels

Overview
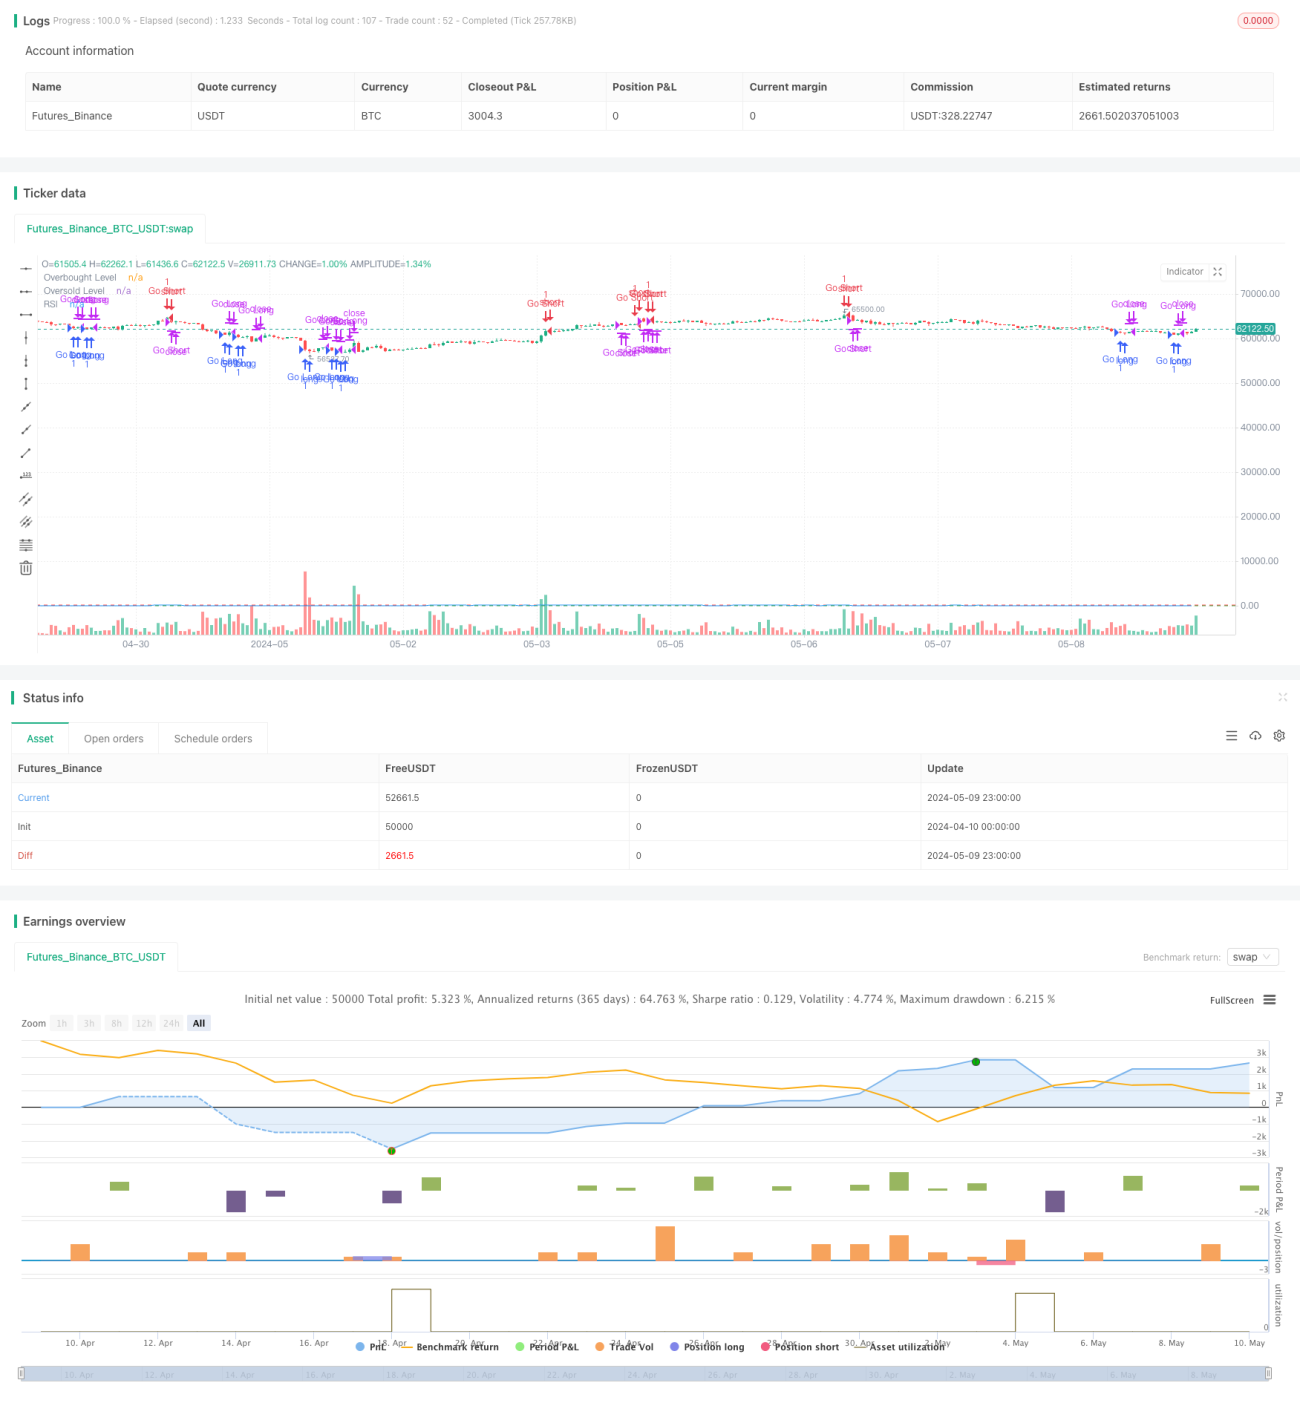
This strategy automatically executes trades based on the overbought and oversold levels of the Relative Strength Index (RSI). It goes long when RSI is below the user-defined oversold level and goes short when RSI is above the user-defined overbought level. Positions are automatically closed after a certain holding period. All parameters can be set by the user, including the RSI period, overbought and oversold levels, and holding time.
Strategy Principles
The Relative Strength Index (RSI) is a momentum indicator that measures the magnitude of recent price changes. It ranges from 0 to 100. Traditionally, an RSI above 70 is considered overbought, and below 30 is considered oversold. This strategy utilizes these principles, buying when RSI is oversold and selling when it is overbought, attempting to capture short-term price reversals. To control risk, the strategy automatically closes positions after a certain holding period.
Strategy Advantages
-
Simplicity: The strategy is based on the classic RSI technical indicator, with a clear and easy-to-understand logic, making it simple to implement.
-
Parameter flexibility: Users can flexibly set parameters such as the RSI period, overbought and oversold thresholds, and holding time according to their preferences and market characteristics.
-
High degree of automation: The strategy can automatically monitor RSI levels and execute opening and closing trades, reducing human intervention and emotional influence.
-
Adaptability: By adjusting parameters, the strategy can be applied to different market environments and trading instruments.
Strategy Risks
-
Parameter optimization difficulty: The optimal parameter combination may vary greatly under different market conditions, requiring extensive backtesting and analysis to find suitable parameters.
-
Market trend risk: When the market exhibits a strong unilateral trend, the strategy may frequently trade and lead to losses.
-
False signal risk: RSI may generate false signals, causing the strategy to make incorrect trades.
-
Black swan events: The strategy has limited adaptability to extreme market conditions and may suffer significant losses in the face of black swan events.
Strategy Optimization Directions
-
Combining with other indicators: Relying solely on RSI may not be robust enough. Consider combining with other technical indicators such as moving averages or MACD to improve signal reliability.
-
Introducing stop-loss and take-profit: Incorporate stop-loss and take-profit mechanisms into the strategy to better control the risk and return of individual trades.
-
Dynamic parameter adjustment: Dynamically adjust parameters such as the RSI period and overbought/oversold thresholds based on changes in market conditions to make the strategy more adaptive.
-
Market state filtering: Filter out unfavorable market states for trading based on indicators such as market volatility and trend strength to improve the strategy's robustness.
Summary
This strategy utilizes the overbought and oversold principles of the RSI indicator to construct a simple and easy-to-understand automated trading system. Users can flexibly set various parameters, and the strategy automatically executes trades. However, the strategy also faces issues such as difficulty in parameter optimization, trend risk, and false signal risk. In the future, optimization measures such as introducing other indicators, stop-loss and take-profit mechanisms, dynamic parameter adjustment, and market state filtering can be considered to enhance the strategy's robustness and profitability.
- 1