概述
本策略是一种基于珊瑚趋势指标交叉的中长期交易策略。它利用两条不同参数的珊瑚趋势线来识别潜在的买入机会。该策略主要适用于较长时间周期,如1个月或3个月图表,旨在捕捉大趋势中的有利买入点。
策略原理
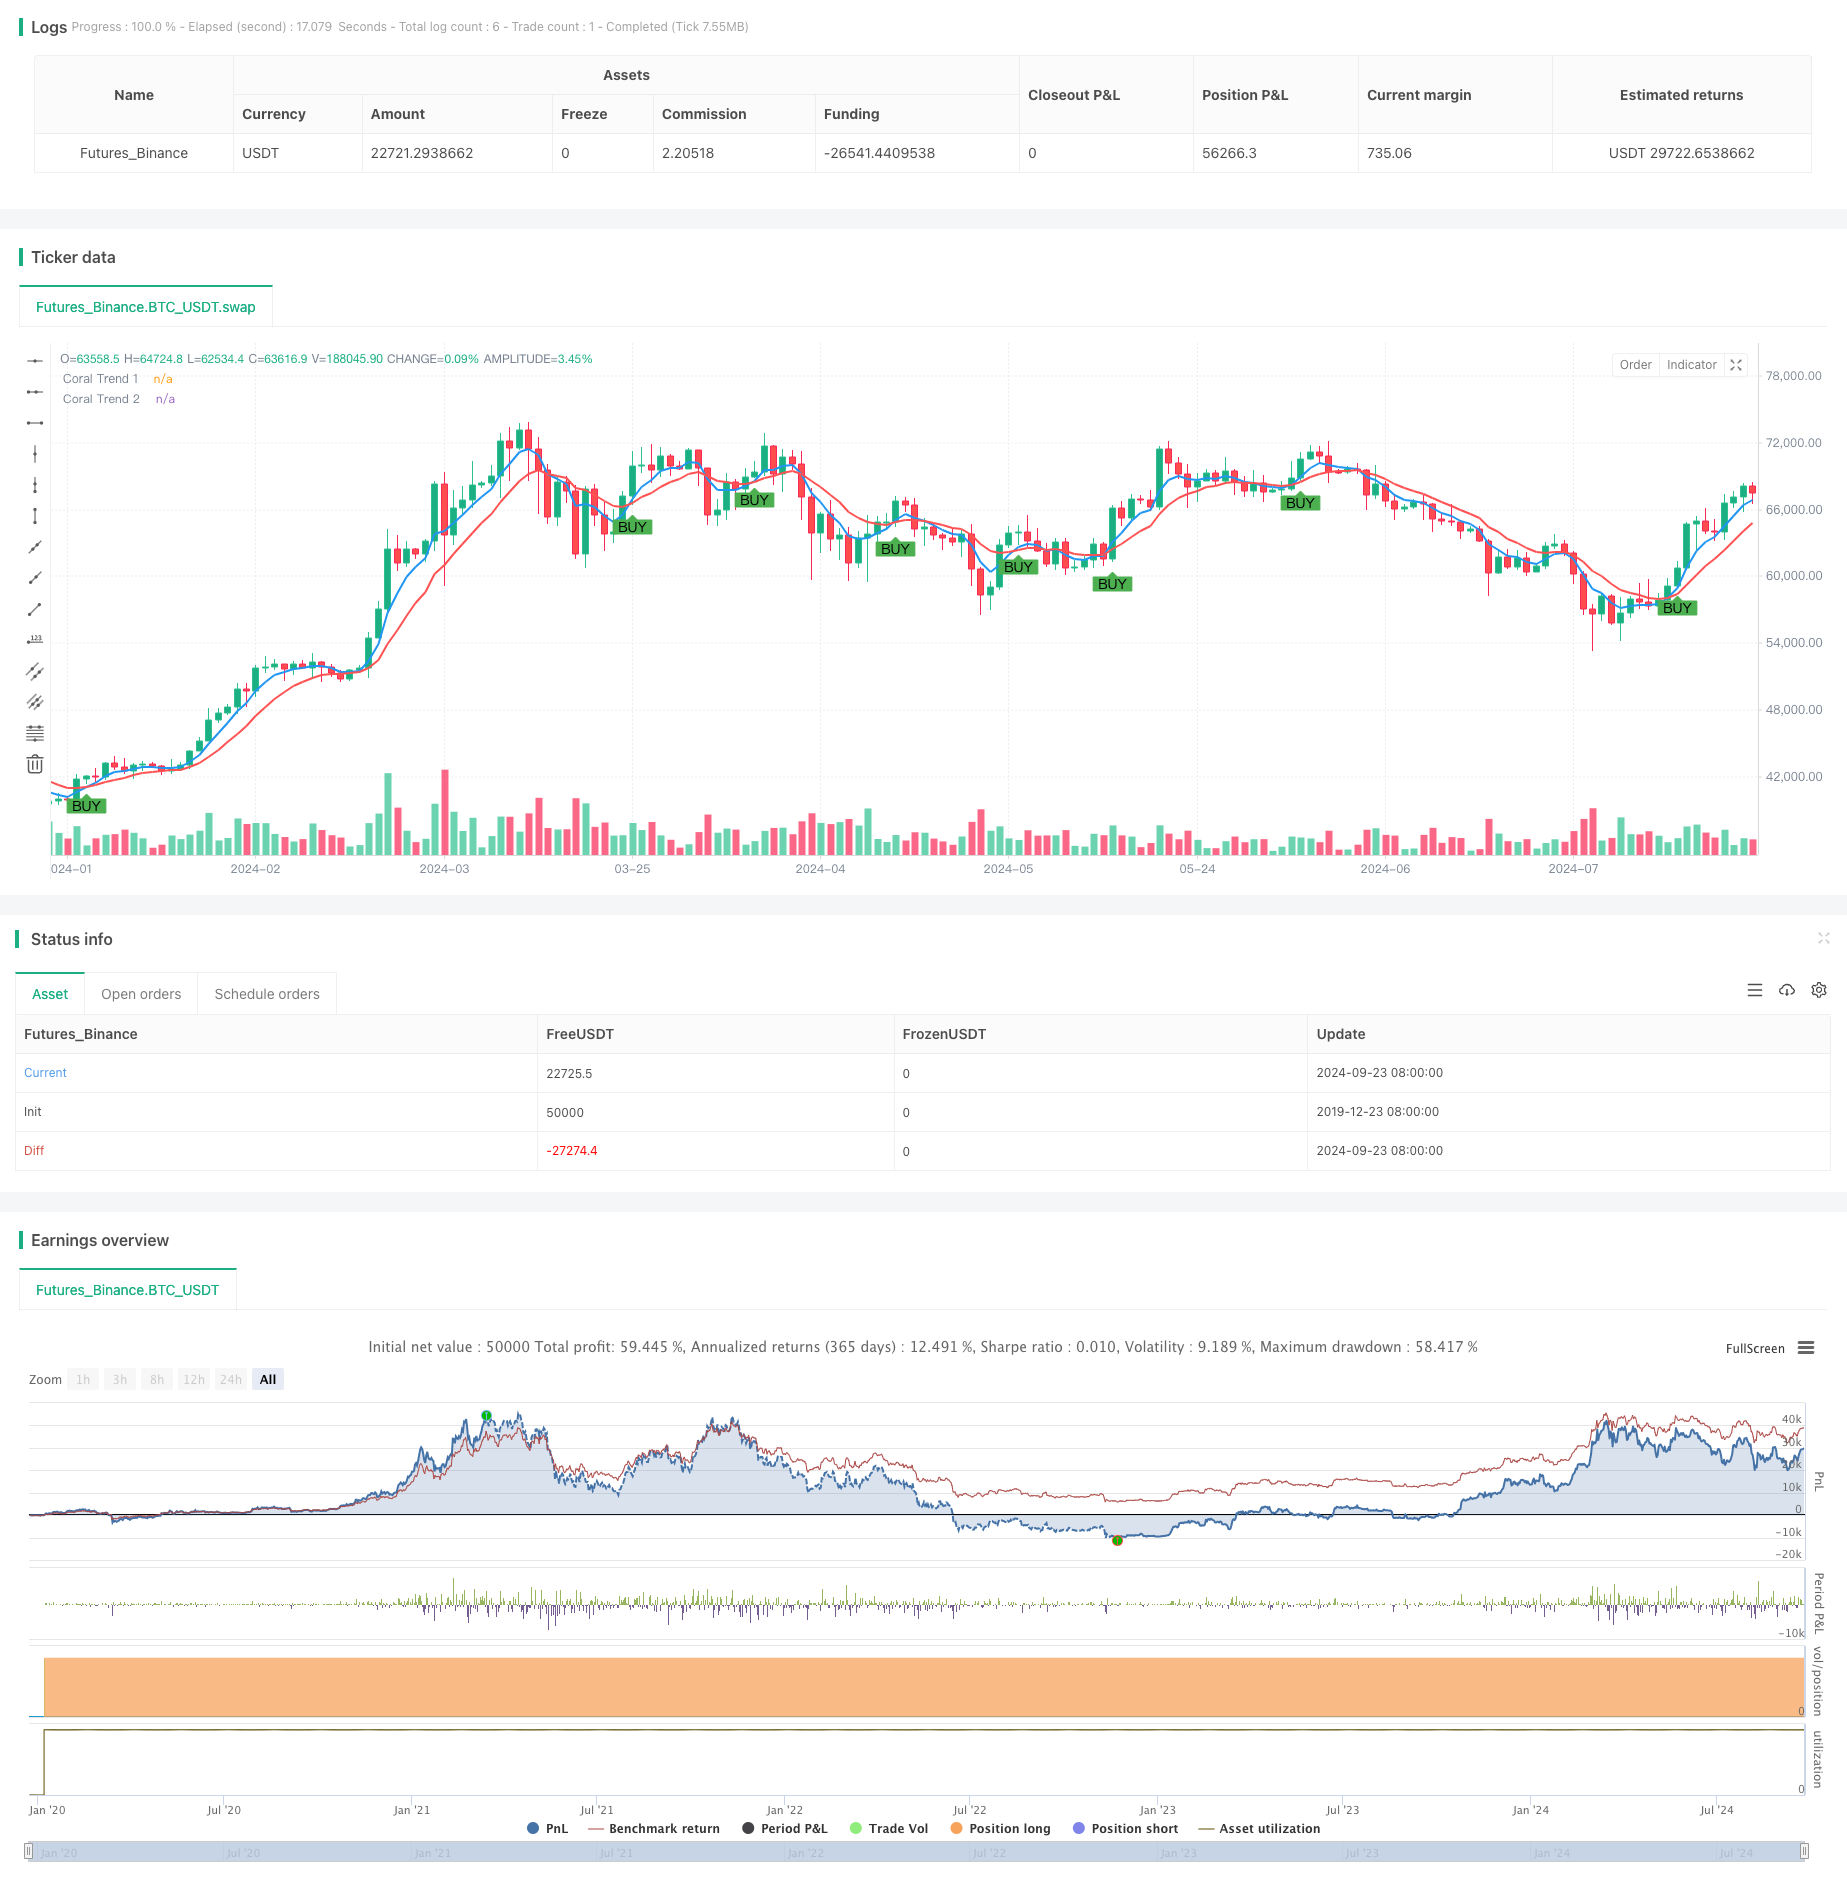
策略的核心是使用两条珊瑚趋势线,分别称为Coral Trend 1和Coral Trend 2。每条趋势线都基于指数移动平均线(EMA)计算,并加入了额外的平滑处理。当Coral Trend 1线从下方穿过Coral Trend 2线时,系统会产生买入信号。这种交叉被认为是潜在上升趋势的开始。
策略的关键参数包括: 1. 两条珊瑚趋势线的平滑周期 2. 常数D值,用于调整趋势线的敏感度
通过调整这些参数,交易者可以根据不同的市场条件和个人偏好来优化策略表现。
策略优势
- 趋势跟踪: 该策略能够有效捕捉中长期趋势,减少短期市场噪音的影响。
- 自适应性: 珊瑚趋势指标具有良好的自适应性,能够在不同市场环境中保持稳定性。
- 可视化: 策略在图表上清晰标示买入信号,便于交易者快速识别交易机会。
- 参数灵活: 交易者可以根据个人需求调整参数,以适应不同的交易风格和市场环境。
- 波动把握: 通过观察趋势线的波动模式,交易者可以选择最佳的入场时机。
策略风险
- 滞后性: 作为趋势跟踪策略,可能在趋势反转初期产生滞后。
- 假突破: 在横盘市场中,可能会出现频繁的假突破信号。
- 参数敏感: 策略性能对参数设置较为敏感,不当的参数可能导致过度交易或错过机会。
- 市场环境依赖: 在剧烈波动或快速反转的市场中,策略表现可能不佳。
策略优化方向
- 增加过滤器: 引入额外的技术指标或市场情绪指标,以减少假信号。
- 动态参数调整: 开发自适应机制,根据市场波动性自动调整参数。
- 多时间框架分析: 结合更短和更长的时间周期信号,提高入场准确性。
- 加入止损和止盈: 设计合理的风险管理机制,保护利润并限制损失。
- 回测优化: 对不同市场和时期进行全面回测,找出最优参数组合。
总结
双重珊瑚趋势交叉策略是一种旨在捕捉中长期市场趋势的有效工具。通过利用两条不同参数的珊瑚趋势线的交叉,该策略能够在保持稳定性的同时,适应不同的市场环境。虽然存在一些固有风险,如滞后性和假突破,但通过careful参数优化和额外的风险管理措施,交易者可以显著提高策略的可靠性和盈利能力。未来的优化方向应着重于提高信号质量、增强自适应性和完善风险控制,以打造一个更加全面和稳健的交易系统。
策略源码
/*backtest
start: 2019-12-23 08:00:00
end: 2024-09-24 08:00:00
period: 1d
basePeriod: 1d
exchanges: [{"eid":"Futures_Binance","currency":"BTC_USDT"}]
*/

//@version=5
strategy("D-Stryker LT", overlay=true)

// Input settings for Coral Trend 1
smoothingPeriod1 = input.int(3, title="Coral Trend 1 Smoothing Period")
constantD1 = input.float(0.2, title="Coral Trend 1 Constant D")

// Input settings for Coral Trend 2
smoothingPeriod2 = input.int(6, title="Coral Trend 2 Smoothing Period")
constantD2 = input.float(0.2, title="Coral Trend 2 Constant D")

// Function to calculate Coral Trend
coralTrend(source, smoothingPeriod, constantD) =>
    emaValue = ta.ema(source, smoothingPeriod)
    smoothEma = ta.ema(emaValue, smoothingPeriod)
    trendLine = smoothEma + constantD * (emaValue - smoothEma)
    trendLine

// Calculate Coral Trends
coralTrend1 = coralTrend(close, smoothingPeriod1, constantD1)
coralTrend2 = coralTrend(close, smoothingPeriod2, constantD2)

// Plot Coral Trends
plot(coralTrend1, title="Coral Trend 1", color=color.blue, linewidth=2)
plot(coralTrend2, title="Coral Trend 2", color=color.red, linewidth=2)

// Generate buy signal when Coral Trend 1 crosses above Coral Trend 2
buySignal = ta.crossover(coralTrend1, coralTrend2)

// Plot buy signals on the chart
plotshape(series=buySignal, title="Buy Signal", location=location.belowbar, color=color.green, style=shape.labelup, text="BUY")

// Optional: Add strategy entry and exit logic
if (buySignal)
    strategy.entry("Buy", strategy.long)
相关推荐