Dynamic ATR-based Trailing Stop Trading Strategy

Overview
This strategy is a dynamic trailing stop strategy based on the Average True Range (ATR) indicator. It adjusts stop-loss positions dynamically through ATR values and confirms trading signals using EMA crossovers. The strategy supports flexible position management and allows customization of buy/sell quantities based on different market environments and trading instruments. It performs particularly well in medium timeframes ranging from 5 minutes to 2 hours, effectively capturing market trends.
Strategy Principles
The core logic of the strategy is based on several key elements:
- Uses ATR indicator to calculate market volatility and adjusts stop-loss distance through user-defined coefficients
- Establishes a dynamic trailing stop line that automatically adjusts with price movements
- Uses EMA crossovers with the trailing stop line to confirm trading signals
- Generates trading signals when price breaks through the trailing stop line with EMA confirmation
- Controls trading quantity through a position management system and tracks portfolio status in real-time
Strategy Advantages
- Strong Adaptability - ATR indicator automatically adjusts stop-loss distance based on market volatility, ensuring good performance in different market environments
- Comprehensive Risk Management - Dynamic trailing stop mechanism effectively protects profits while limiting potential losses
- Operational Flexibility - Supports customizable trading quantities and ATR parameters for optimization across different instruments
- Reliable Signals - EMA confirmation reduces the impact of false signals
- Full Automation - Strategy can run completely automatically, reducing emotional interference
Strategy Risks
- Choppy Market Risk - May generate frequent false breakout signals in sideways markets, leading to excessive trading
- Slippage Risk - May face significant slippage in fast-moving markets, affecting strategy performance
- Parameter Sensitivity - Choice of ATR period and coefficients significantly impacts strategy performance
- Money Management Risk - Improper trading quantity settings may lead to excessive leverage risk
- Market Volatility Risk - Stop-loss levels may be breached instantly during periods of extreme volatility
Strategy Optimization Directions
- Introduce market environment recognition mechanism to use different parameter combinations in different market states
- Add volume factors as signal filters to improve trading signal reliability
- Optimize money management algorithm to dynamically adjust position size based on volatility
- Add time filtering mechanism to avoid trading during unsuitable periods
- Develop adaptive parameter optimization system for dynamic parameter adjustment
Summary
This strategy builds a reliable dynamic trailing stop system by combining ATR indicator and EMA moving average. Its strengths lie in market volatility adaptation, comprehensive risk management, and operational flexibility. While inherent risks exist, the strategy shows promise for stable performance across different market environments through continuous optimization and improvement. Traders are advised to thoroughly test parameter combinations and optimize based on specific instrument characteristics before live trading.
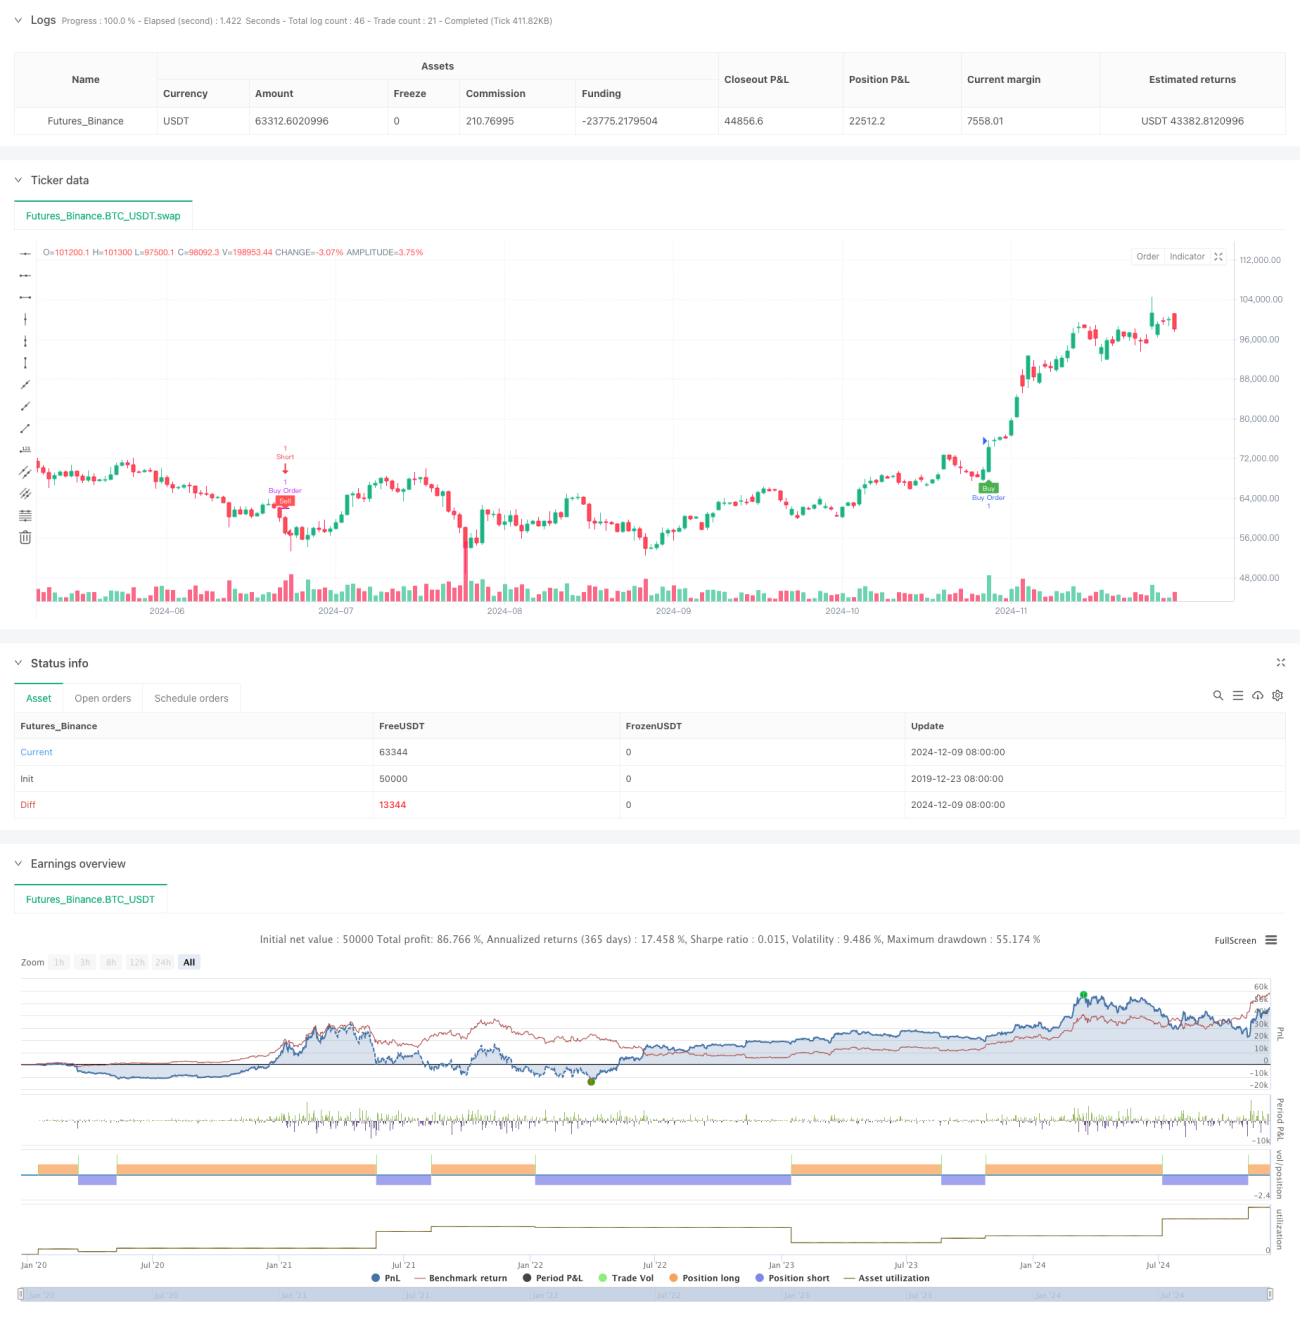
/*backtest
start: 2019-12-23 08:00:00
end: 2024-12-10 08:00:00
period: 1d
basePeriod: 1d
exchanges: [{"eid":"Futures_Binance","currency":"BTC_USDT"}]
*/

//@version=5
strategy(title='ADET GİRMELİ Trend İz Süren Stop Strategy', overlay=true, overlay=true,default_qty_type = strategy.fixed, default_qty_value = 1)

// Inputs- 1