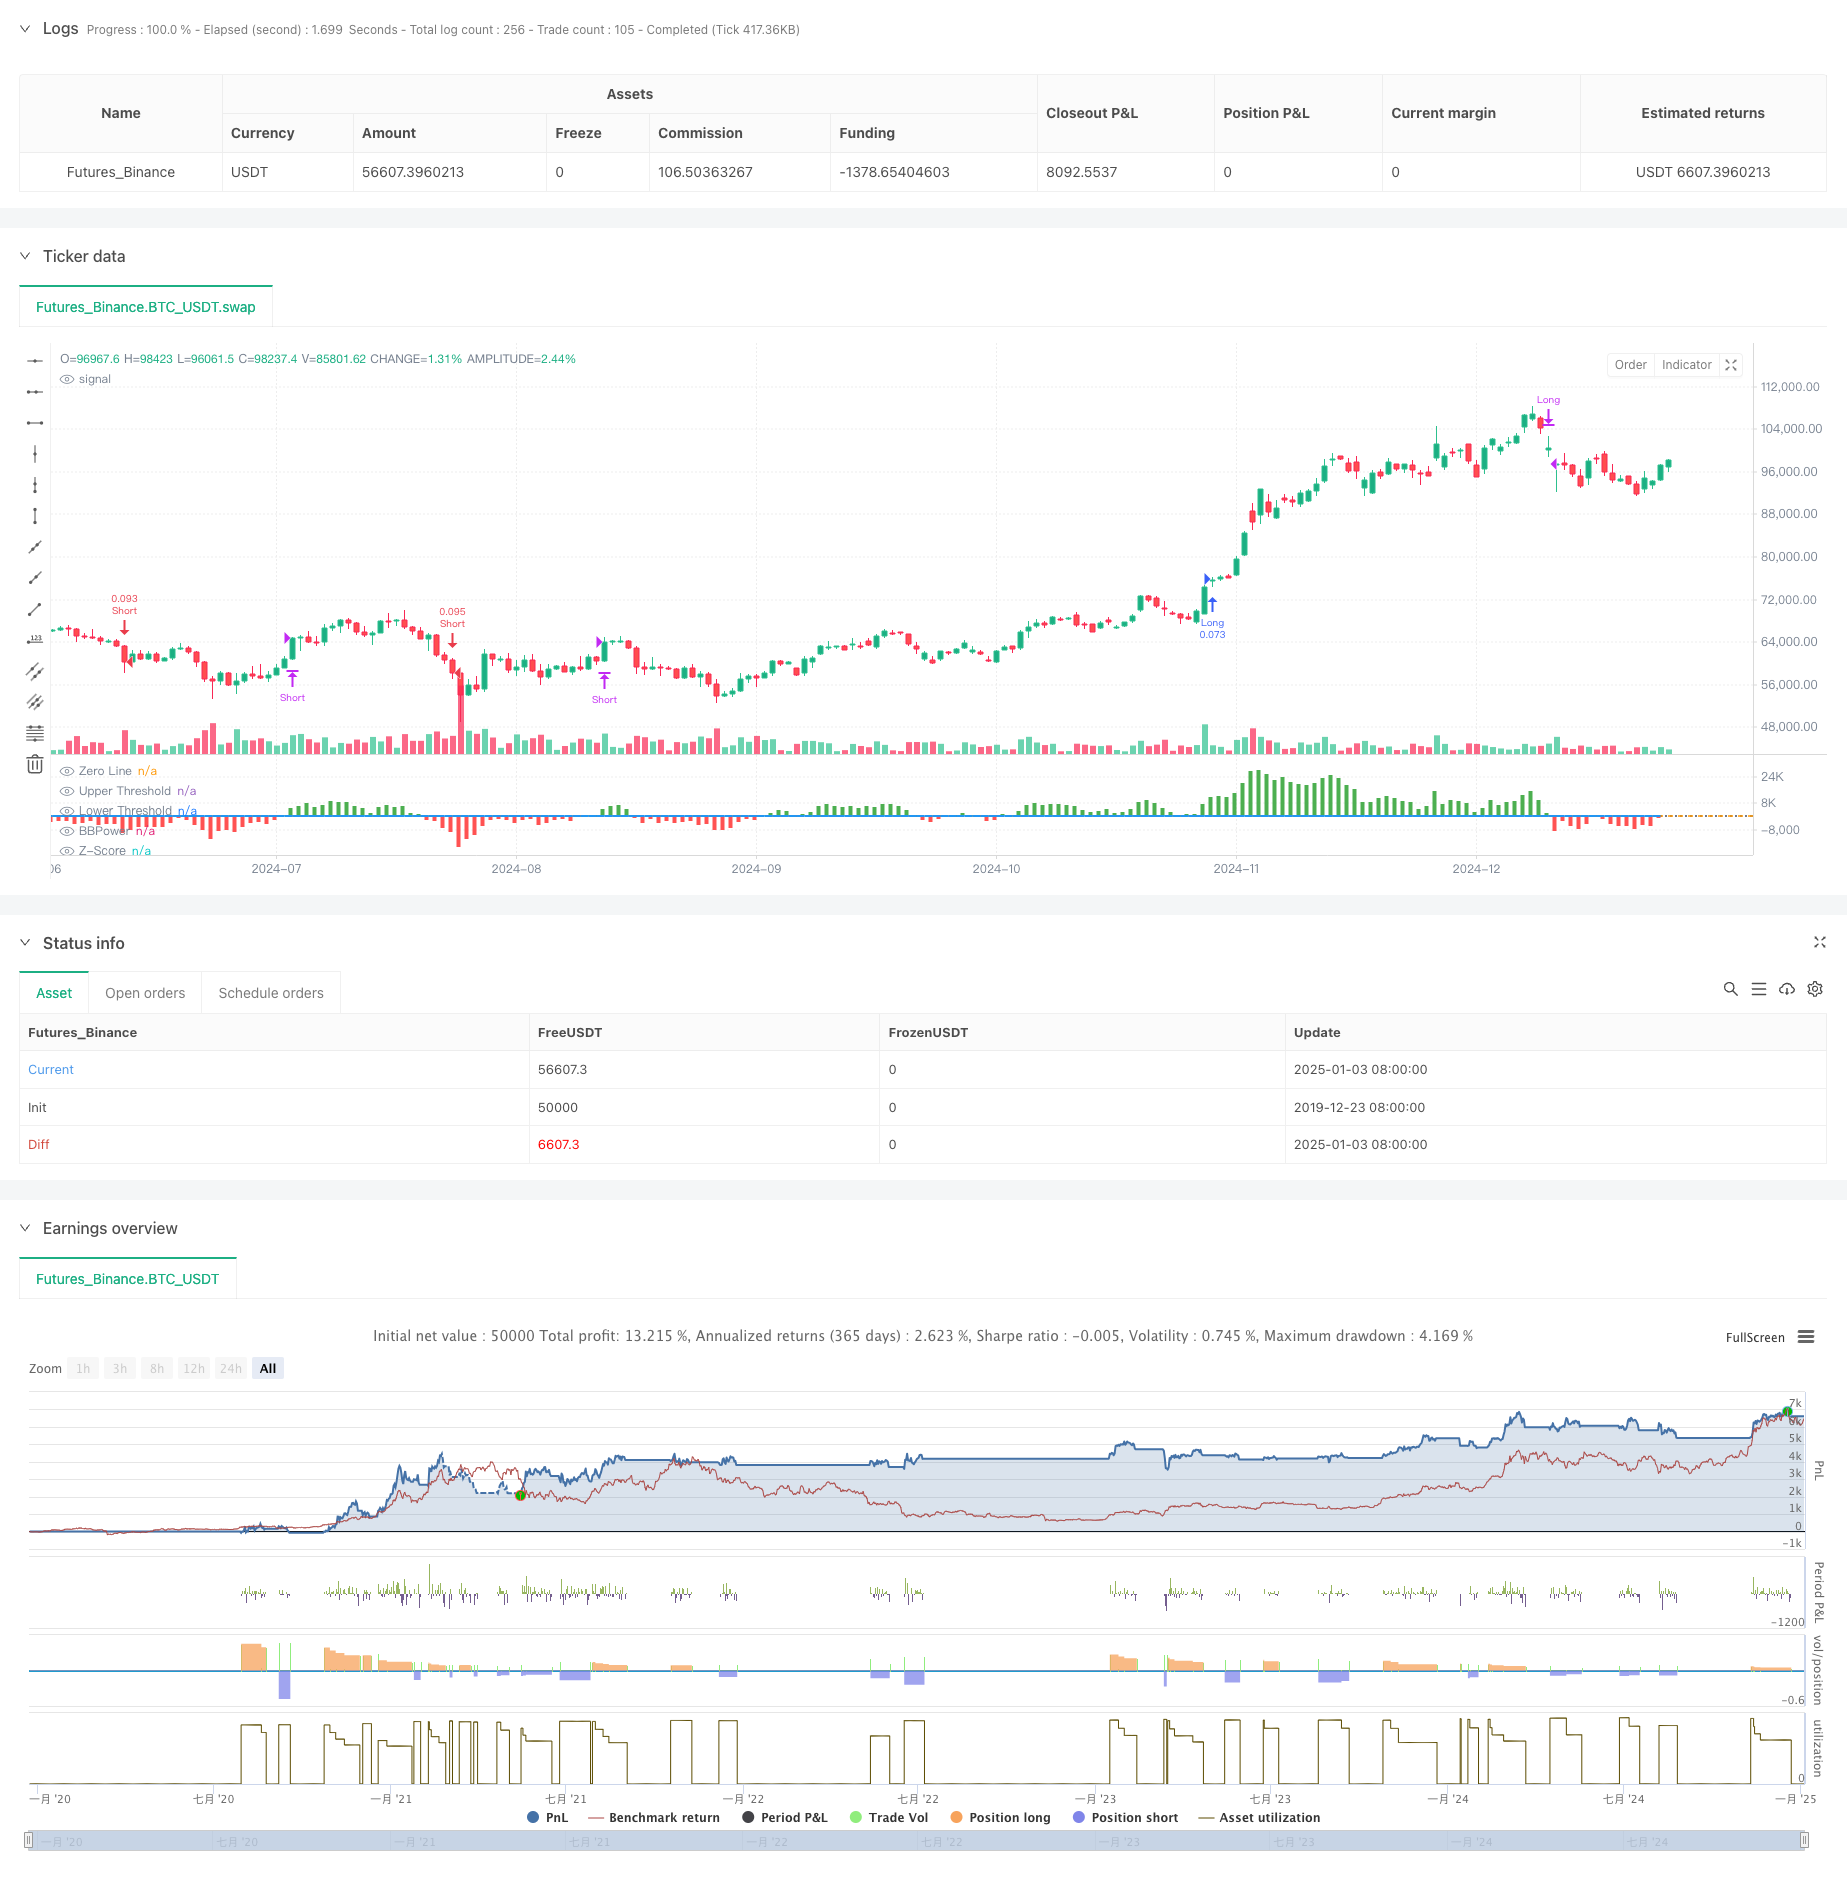
概述
本策略是一个结合了波尔贝尔指标(Bull Bear Power)和基于成交量分位数的多级动态止盈系统的量化交易策略。该策略通过对价格、成交量和动量等多维度数据的分析,构建了一个自适应性强、风险可控的交易系统。核心逻辑包括使用BBP指标的Z-Score标准化数值作为交易信号触发条件,同时结合成交量分位数分析来动态调整止盈水平,实现了对市场不同波动状态的精准把握。
策略原理
策略的核心计算包括以下几个关键部分: 1. BBP指标计算:通过计算最高价与EMA的差值(牛力)和最低价与EMA的差值(熊力)之和来衡量市场力量对比。 2. Z-Score标准化:对BBP值进行标准化处理,用于判断当前市场强弱程度的偏离水平。 3. 成交量分析:计算当前成交量相对于移动平均的倍数,用于判断市场活跃度。 4. 分位数分析:计算价格和成交量的历史分位数,用于市场状态的概率分布定位。 5. 动态止盈:基于ATR、成交量分位和价格分位的综合评分来动态调整止盈距离。
策略优势
- 多维度分析:综合考虑价格动量、成交量和市场位置,提供更全面的市场视角。
- 自适应性强:通过动态调整的止盈机制,能够适应不同的市场环境。
- 风险分散:采用多级止盈策略,在不同价格水平实现利润释放。
- 概率优势:通过Z-Score和分位数分析,在统计上具有显著优势。
- 可扩展性:策略框架具有良好的可扩展性,可以根据需要添加新的分析维度。
策略风险
- 参数敏感性:策略包含多个参数,需要针对不同市场环境进行优化。
- 市场环境依赖:在剧烈波动或趋势转换期可能表现不佳。
- 执行滑点:多级止盈订单可能面临执行滑点,影响实际收益。
- 计算复杂度:实时计算多个指标可能带来一定的系统负荷。
- 假信号风险:在横盘市场可能产生错误的交易信号。
优化方向
- 参数自适应:引入机器学习方法,实现参数的自动优化。
- 市场预判:增加市场环境分类模块,提前识别不利的交易环境。
- 止损优化:引入动态止损机制,提高风险控制的精确度。
- 信号过滤:增加趋势强度过滤器,减少假信号。
- 仓位管理:优化仓位分配算法,提高资金使用效率。
总结
该策略通过将传统的BBP指标与现代量化分析方法相结合,构建了一个理论基础扎实、实用性强的交易系统。通过多级止盈和动态调整机制,较好地平衡了收益和风险。虽然存在一定的参数优化难度,但策略框架的可扩展性为后续优化提供了充分空间。在实际应用中,建议交易者根据具体市场特点和自身风险偏好进行针对性调整。
策略源码
/*backtest
start: 2019-12-23 08:00:00
end: 2025-01-04 08:00:00
period: 1d
basePeriod: 1d
exchanges: [{"eid":"Futures_Binance","currency":"BTC_USDT"}]
*/

// This Pine Script™ code is subject to the terms of the Mozilla Public License 2.0 at https://mozilla.org/MPL/2.0/
// © PresentTrading

// The BBP Strategy with Volume-Percentile TP by PresentTrading emerges as a sophisticated approach that integrates multiple analytical layers to enhance trading precision and profitability.
// Unlike traditional strategies that rely solely on price movements or volume indicators, this strategy synergizes Bollinger Bands Power (BBP) with volume percentile analysis to determine optimal entry and exit points. Additionally, it employs a dynamic take-profit mechanism based on ATR (Average True Range) multipliers adjusted by volume and percentile factors, ensuring adaptability to varying market conditions.
// This multi-faceted approach not only enhances signal accuracy but also optimizes risk management, setting it apart from conventional trading methodologies.

//@version=5
strategy("BBP Strategy with Volume-Percentile TP - Strategy [presentTrading] ", overlay=false, precision=3, commission_value= 0.1, commission_type=strategy.commission.percent, slippage= 1, currency=currency.USD, default_qty_type = strategy.percent_of_equity, default_qty_value = 10, initial_capital=10000)


// ————————
// Bull Bear Power Strategy Settings
// ————————
lengthInput = input.int(21, "EMA Length")
zLength     = input.int(252, "Z-Score Length")
zThreshold  = input.float(1.618, "Z-Score Threshold")

// ————————
// Take Profit Settings
// ————————
tp_group = "Take Profit Settings"
// Enable/disable take profit function
useTP = input.bool(true, "Use Take Profit", group=tp_group)

// === ATR Base Settings ===
// ATR calculation period for determining base price movement range
baseAtrLength = input.int(20, "ATR Period", minval=1, group=tp_group, tooltip="ATR period for calculating base price movement range. Shorter periods are more sensitive to recent volatility")

// === Take Profit Multiplier Settings ===
// First take profit ATR multiplier, usually the most conservative target
atrMult1 = input.float(1.618, "TP1 ATR Multiplier", minval=0.1, step=0.1, group=tp_group, tooltip="First take profit level ATR multiplier, recommended 1.5-2.0")
// Second take profit ATR multiplier, medium profit target
atrMult2 = input.float(2.382, "TP2 ATR Multiplier", minval=0.1, step=0.1, group=tp_group, tooltip="Second take profit level ATR multiplier, recommended 2.5-3.0")
// Third take profit ATR multiplier, most aggressive target
atrMult3 = input.float(3.618, "TP3 ATR Multiplier", minval=0.1, step=0.1, group=tp_group, tooltip="Third take profit level ATR multiplier, recommended 4.0-5.0")

// === Position Size Allocation ===
// First take profit position size, usually larger for securing basic profits
tp1_size = input.float(13, "TP1 Position %", minval=1, maxval=100, group=tp_group, tooltip="Position size percentage for first take profit, recommended 30-40%")
// Second take profit position size, medium allocation
tp2_size = input.float(13, "TP2 Position %", minval=1, maxval=100, group=tp_group, tooltip="Position size percentage for second take profit, recommended 30-40%")
// Third take profit position size, usually smaller for catching larger moves
tp3_size = input.float(13, "TP3 Position %", minval=1, maxval=100, group=tp_group, tooltip="Position size percentage for third take profit, recommended 20-30%")

// ————————
// Volume Analysis Settings
// ————————
vol_group = "Volume Analysis Settings"
// Volume MA period for determining relative volume levels
vol_period = input.int(100, "Volume MA Period", minval=1, group=vol_group, tooltip="Period for calculating volume moving average, recommended 20-30")

// === Volume Level Thresholds ===
// High volume threshold relative to MA
vol_high = input.float(2.0, "High Volume Multiplier", minval=1.0, step=0.1, group=vol_group, tooltip="High volume threshold multiplier, typically 2x MA or above")
// Medium volume threshold
vol_med = input.float(1.5, "Medium Volume Multiplier", minval=1.0, step=0.1, group=vol_group, tooltip="Medium volume threshold multiplier, typically around 1.5x MA")
// Low volume threshold
vol_low = input.float(1.0, "Low Volume Multiplier", minval=0.5, step=0.1, group=vol_group, tooltip="Low volume threshold multiplier, typically around 1x MA")

// === Volume Adjustment Factors ===
// High volume adjustment factor, usually extends take profit targets
vol_high_mult = input.float(1.5, "High Volume Factor", minval=0.1, step=0.1, group=vol_group, tooltip="Take profit adjustment factor for high volume")
// Medium volume adjustment factor
vol_med_mult = input.float(1.3, "Medium Volume Factor", minval=0.1, step=0.1, group=vol_group, tooltip="Take profit adjustment factor for medium volume")
// Low volume adjustment factor
vol_low_mult = input.float(1.0, "Low Volume Factor", minval=0.1, step=0.1, group=vol_group, tooltip="Take profit adjustment factor for low volume")

// ————————
// Percentile Analysis Settings
// ————————
perc_group = "Percentile Analysis Settings"
// Percentile calculation period for evaluating price position
perc_period = input.int(100, "Percentile Period", minval=20, group=perc_group, tooltip="Historical period for percentile calculations, recommended 100-200")

// === Percentile Thresholds ===
// High percentile threshold, typically indicates relative high levels
perc_high = input.float(90, "High Percentile", minval=50, maxval=100, group=perc_group, tooltip="High level percentile threshold, typically above 90")
// Medium percentile threshold
perc_med = input.float(80, "Medium Percentile", minval=50, maxval=100, group=perc_group, tooltip="Medium level percentile threshold, typically around 80")
// Low percentile threshold
perc_low = input.float(70, "Low Percentile", minval=0, maxval=100, group=perc_group, tooltip="Low level percentile threshold, typically around 70")

// === Percentile Adjustment Factors ===
// High percentile adjustment factor
perc_high_mult = input.float(1.5, "High Percentile Factor", minval=0.1, step=0.1, group=perc_group, tooltip="Take profit adjustment factor for high percentile levels")
// Medium percentile adjustment factor
perc_med_mult = input.float(1.3, "Medium Percentile Factor", minval=0.1, step=0.1, group=perc_group, tooltip="Take profit adjustment factor for medium percentile levels")
// Low percentile adjustment factor
perc_low_mult = input.float(1.0, "Low Percentile Factor", minval=0.1, step=0.1, group=perc_group, tooltip="Take profit adjustment factor for low percentile levels")


// ————————
// Core Bull Bear Power Calculations
// ————————
emaClose  = ta.ema(close, lengthInput)
bullPower = high - emaClose
bearPower = low  - emaClose
bbp       = bullPower + bearPower

bbp_mean  = ta.sma(bbp, zLength)
bbp_std   = ta.stdev(bbp, zLength)
zscore    = (bbp - bbp_mean) / bbp_std

// ————————
// Volume & Percentile Analysis
// ————————
// 成交量分析
vol_sma = ta.sma(volume, vol_period)
vol_mult = volume / vol_sma

// 百分位數計算
calcPercentile(src) =>
    var values = array.new_float(0)
    array.unshift(values, src)
    if array.size(values) > perc_period
        array.pop(values)
    array.size(values) > 0 ? array.percentrank(values, array.size(values)-1) * 100 : 50

price_perc = calcPercentile(close)
vol_perc = calcPercentile(volume)

// 止盈動態調整系數計算
getTpFactor() =>
    vol_score = vol_mult > vol_high ? vol_high_mult : vol_mult > vol_med ? vol_med_mult : vol_mult > vol_low ? vol_low_mult : 0.8
    price_score = price_perc > perc_high ? perc_high_mult :price_perc > perc_med ? perc_med_mult :price_perc > perc_low ? perc_low_mult : 0.8
    math.avg(vol_score, price_score)

// ————————
// Entry/Exit Logic
// ————————
longCondition  = ta.crossover(zscore,  zThreshold)
shortCondition = ta.crossunder(zscore, -zThreshold)
exitLongCondition  = ta.crossunder(zscore, 0)
exitShortCondition = ta.crossover(zscore,  0)

if (barstate.isconfirmed)
    if longCondition
        strategy.entry("Long", strategy.long)
    if shortCondition
        strategy.entry("Short", strategy.short)
    if exitLongCondition
        strategy.close("Long")
    if exitShortCondition
        strategy.close("Short")

// ————————
// Take Profit Execution
// ————————
if useTP and strategy.position_size != 0
    base_move = ta.atr(baseAtrLength)
    tp_factor = getTpFactor()
    is_long = strategy.position_size > 0
    entry_price = strategy.position_avg_price

    if is_long
        tp1_price = entry_price + (base_move * atrMult1 * tp_factor)
        tp2_price = entry_price + (base_move * atrMult2 * tp_factor)
        tp3_price = entry_price + (base_move * atrMult3 * tp_factor)

        strategy.exit("TP1", "Long", qty_percent=tp1_size, limit=tp1_price)
        strategy.exit("TP2", "Long", qty_percent=tp2_size, limit=tp2_price)
        strategy.exit("TP3", "Long", qty_percent=tp3_size, limit=tp3_price)
    else
        tp1_price = entry_price - (base_move * atrMult1 * tp_factor)
        tp2_price = entry_price - (base_move * atrMult2 * tp_factor)
        tp3_price = entry_price - (base_move * atrMult3 * tp_factor)

        strategy.exit("TP1", "Short", qty_percent=tp1_size, limit=tp1_price)
        strategy.exit("TP2", "Short", qty_percent=tp2_size, limit=tp2_price)
        strategy.exit("TP3", "Short", qty_percent=tp3_size, limit=tp3_price)

// ————————
// Plotting
// ————————
plot(bbp, color=bbp >= 0 ? color.new(color.green, 0) : color.new(color.red, 0),
     title="BBPower", style=plot.style_columns)
hline(0, "Zero Line", color=color.gray, linestyle=hline.style_dotted)
plot(zscore, title="Z-Score", color=color.blue, linewidth=2)
hline(zThreshold, "Upper Threshold", color=color.orange, linestyle=hline.style_dashed)
hline(-zThreshold, "Lower Threshold", color=color.orange, linestyle=hline.style_dashed)
相关推荐