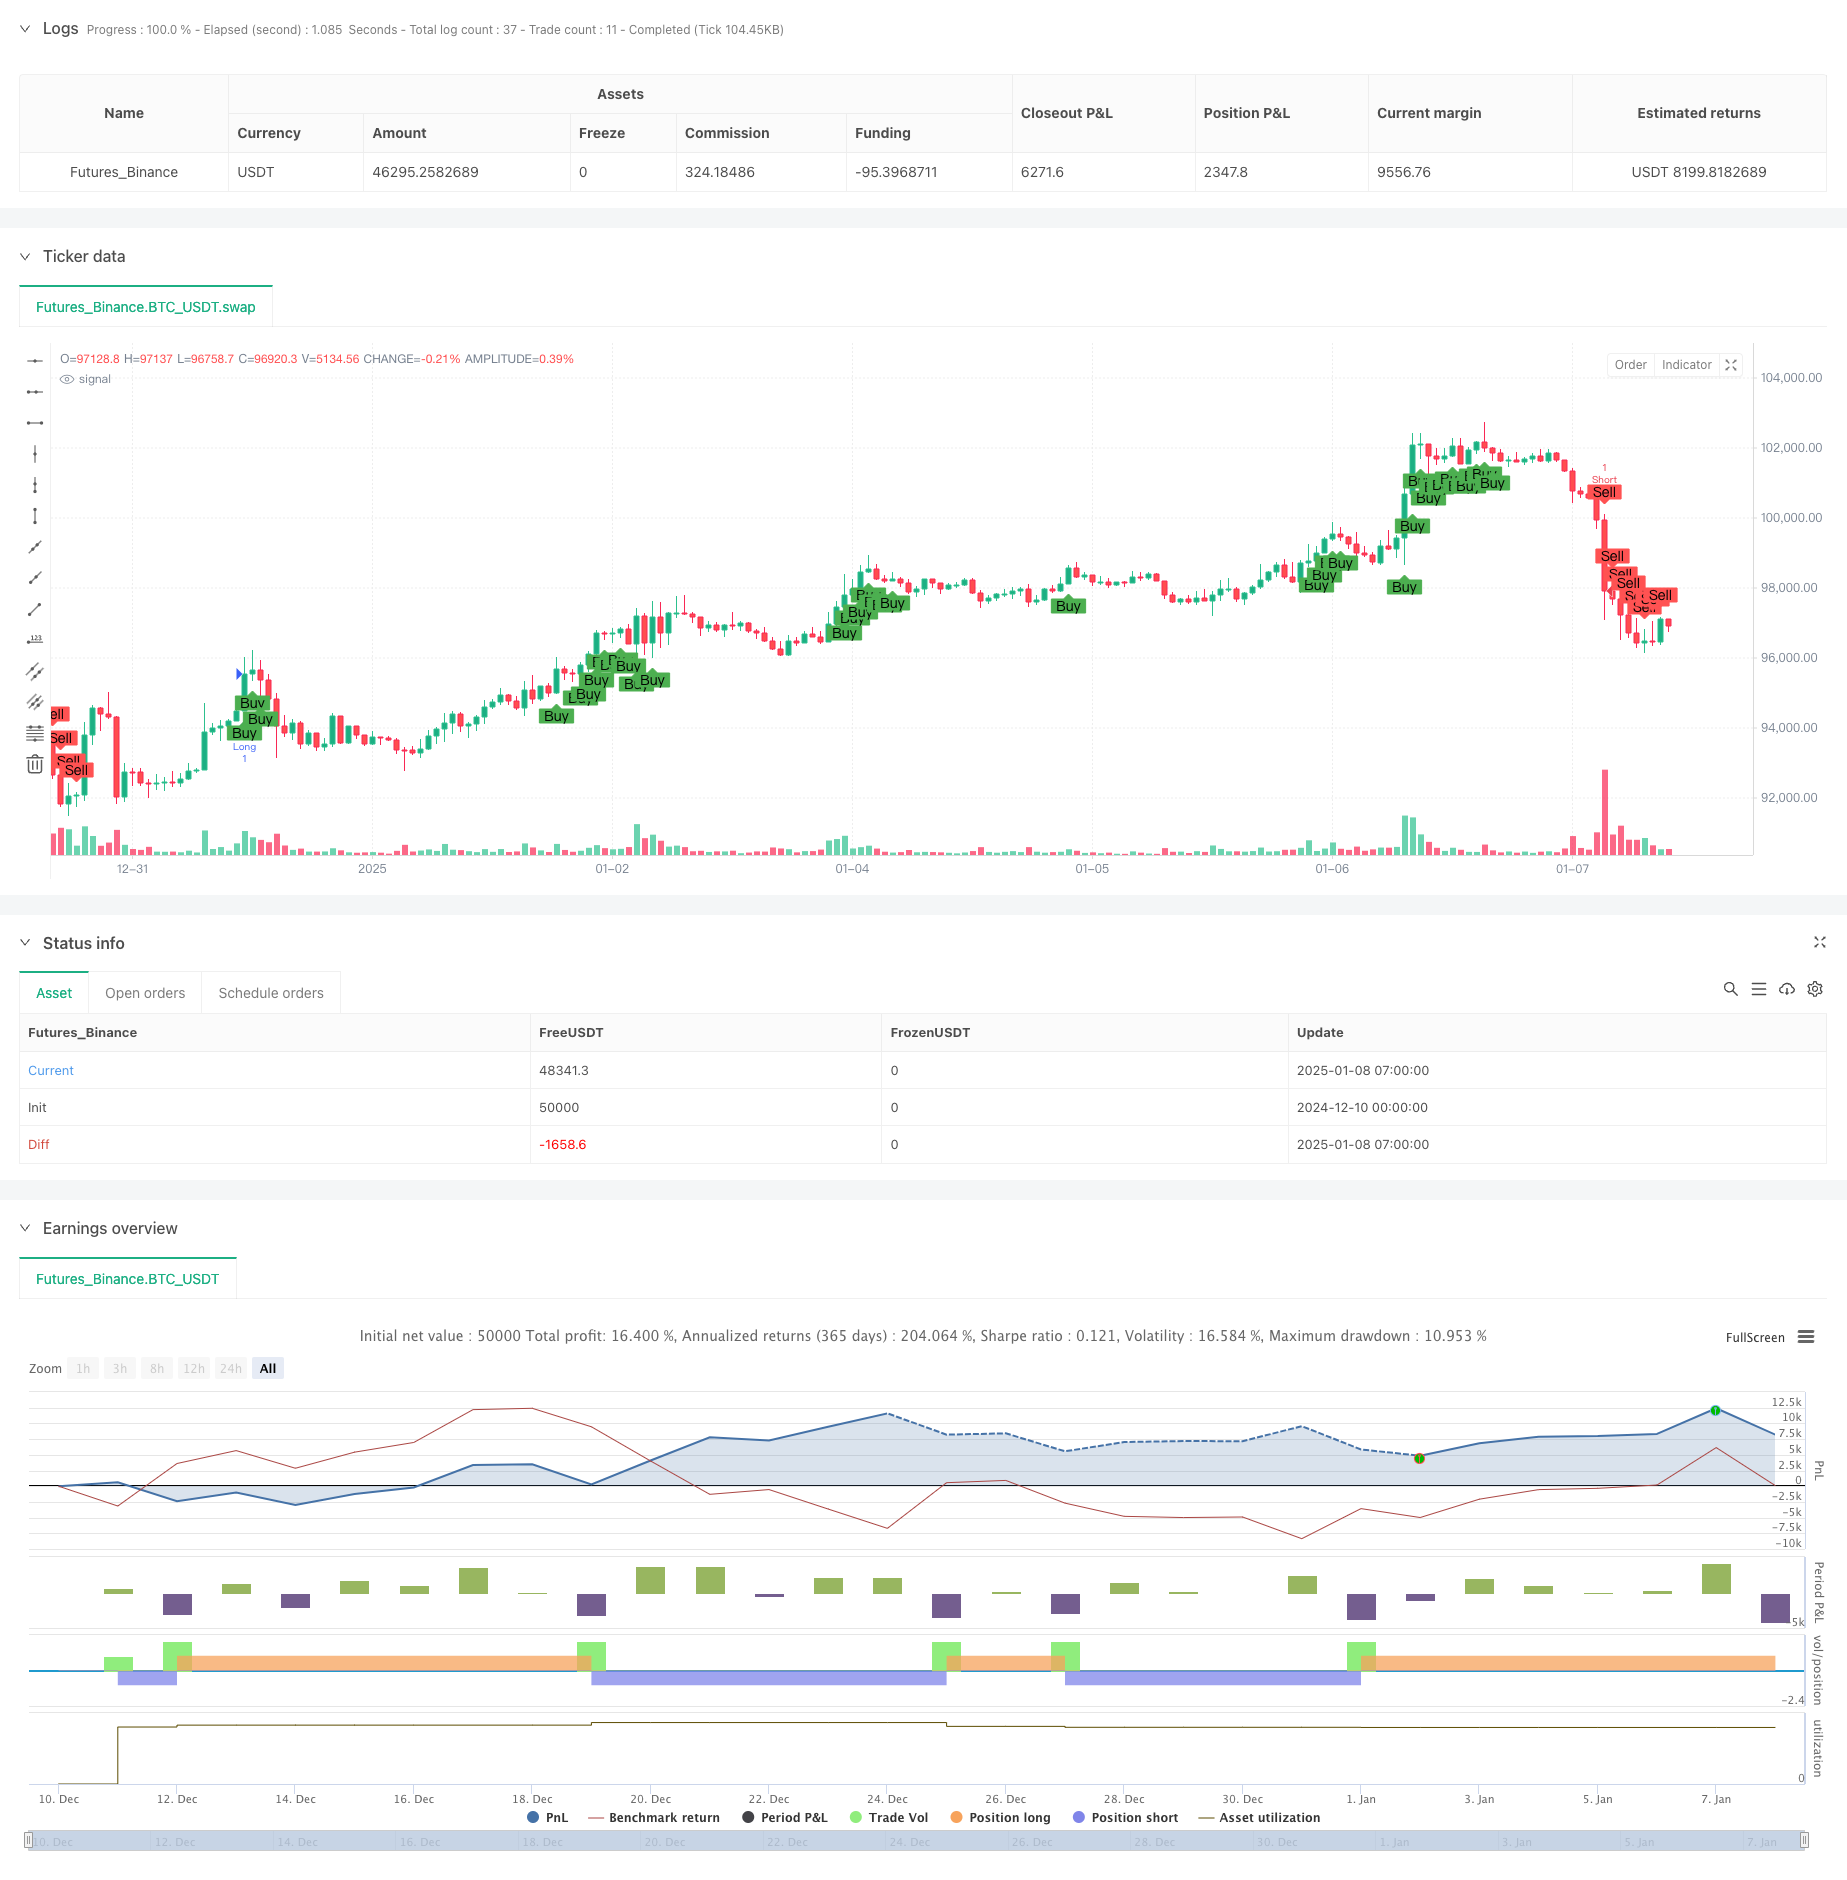
概述
这是一个结合了指数移动平均线(EMA)和相对强弱指标(RSI)的趋势跟踪策略。策略通过监测快速和慢速EMA的交叉,同时结合RSI指标的超买超卖水平以及RSI背离来确定交易信号,实现对市场趋势的有效把握。策略在1小时时间周期上运行,通过多重技术指标的验证来提高交易的准确性。
策略原理
策略的核心逻辑包含以下几个关键要素: 1. 使用9周期和26周期的EMA来确定趋势方向,快线在慢线上方视为上升趋势,反之为下降趋势 2. 采用14周期的RSI指标,设定65和35作为多空信号的触发阈值 3. 在1小时时间周期上检测RSI背离,通过对比价格高低点与RSI高低点来识别潜在的趋势转折 4. 多头交易信号需满足:快速EMA在慢速EMA上方、RSI大于65、且无RSI看跌背离 5. 空头交易信号需满足:快速EMA在慢速EMA下方、RSI小于35、且无RSI看涨背离
策略优势
- 多重技术指标的交叉验证提高了交易信号的可靠性
- 通过RSI背离的检测降低了假突破带来的风险
- 结合了趋势跟踪和超买超卖的优势,既能把握大趋势又不错过短期交易机会
- 参数可根据不同市场特征进行优化调整
- 策略逻辑清晰,易于理解和执行
策略风险
- EMA作为滞后指标可能导致入场点不够理想
- RSI在震荡市场可能产生过多交易信号
- 背离判断可能出现误判,尤其在高波动市场
- 市场快速转向时可能造成较大回撤 缓解措施:
- 可增加止损止盈设置
- 考虑加入成交量指标验证
- 在震荡市调整RSI阈值
策略优化方向
- 引入自适应的RSI阈值,根据市场波动情况动态调整
- 加入成交量指标作为信号确认
- 开发更精确的背离检测算法
- 增加止损止盈管理机制
- 考虑添加市场波动率过滤器
总结
该策略通过结合均线系统、动量指标和背离分析,构建了一个相对完整的交易系统。策略注重信号的多重验证,有效降低了误判风险。虽然存在一定的滞后性,但通过参数优化和风险管理的改进,策略具有较好的实战应用价值。
策略源码
/*backtest
start: 2024-12-10 00:00:00
end: 2025-01-08 08:00:00
period: 1h
basePeriod: 1h
exchanges: [{"eid":"Futures_Binance","currency":"BTC_USDT"}]
*/

//@version=5
strategy("EMA9_RSI_Strategy_LongShort", overlay=true)

// Parameters
fastLength = input.int(9, minval=1, title="Fast EMA Length")
slowLength = input.int(26, minval=1, title="Slow EMA Length")
rsiPeriod = input.int(14, minval=1, title="RSI Period")
rsiLevelLong = input.int(65, minval=1, title="RSI Level (Long)")
rsiLevelShort = input.int(35, minval=1, title="RSI Level (Short)")

// Define 1-hour timeframe
timeframe_1h = "60"

// Fetch 1-hour data
high_1h = request.security(syminfo.tickerid, timeframe_1h, high)
low_1h = request.security(syminfo.tickerid, timeframe_1h, low)
rsi_1h = request.security(syminfo.tickerid, timeframe_1h, ta.rsi(close, rsiPeriod))

// Current RSI
rsi = ta.rsi(close, rsiPeriod)

// Find highest/lowest price and corresponding RSI in the 1-hour timeframe
highestPrice_1h = ta.highest(high_1h, 1) // ราคาสูงสุดใน 1 ช่วงของ timeframe 1 ชั่วโมง
lowestPrice_1h = ta.lowest(low_1h, 1)   // ราคาต่ำสุดใน 1 ช่วงของ timeframe 1 ชั่วโมง
highestRsi_1h = ta.valuewhen(high_1h == highestPrice_1h, rsi_1h, 0)
lowestRsi_1h = ta.valuewhen(low_1h == lowestPrice_1h, rsi_1h, 0)

// Detect RSI Divergence for Long
bearishDivLong = high > highestPrice_1h and rsi < highestRsi_1h
bullishDivLong = low < lowestPrice_1h and rsi > lowestRsi_1h
divergenceLong = bearishDivLong or bullishDivLong

// Detect RSI Divergence for Short (switch to low price for divergence check)
bearishDivShort = low > lowestPrice_1h and rsi < lowestRsi_1h
bullishDivShort = high < highestPrice_1h and rsi > highestRsi_1h
divergenceShort = bearishDivShort or bullishDivShort

// Calculate EMA
emaFast = ta.ema(close, fastLength)
emaSlow = ta.ema(close, slowLength)

// Long Conditions
longCondition = emaFast > emaSlow and rsi > rsiLevelLong and not divergenceLong

// Short Conditions
shortCondition = emaFast < emaSlow and rsi < rsiLevelShort and not divergenceShort

// Plot conditions
plotshape(longCondition, title="Buy", location=location.belowbar, color=color.green, style=shape.labelup, text="Buy")
plotshape(shortCondition, title="Sell", location=location.abovebar, color=color.red, style=shape.labeldown, text="Sell")

// Execute the strategy
if (longCondition)
    strategy.entry("Long", strategy.long, comment="entry long")

if (shortCondition)
    strategy.entry("Short", strategy.short, comment="entry short")

// Alert
alertcondition(longCondition, title="Buy Signal", message="Buy signal triggered!")
alertcondition(shortCondition, title="Sell Signal", message="Sell signal triggered!")
相关推荐