
多时间框架趋势动量与VWAP反弹交叉量化策略
概述
该策略是一个综合性的日内交易系统,结合了多时间框架分析、趋势确认和价格动量指标,通过EMA交叉和VWAP反弹信号生成交易决策。策略核心是在1小时时间框架确认总体趋势方向,然后在15分钟图表上寻找符合趋势方向的入场信号,同时使用RSI指标过滤过度买入或卖出的情况,并通过ATR指标控制波动性风险。该策略还实现了每日信号限制、交易时段管理和动态移动止损机制,旨在捕捉日内趋势移动并有效管理风险。
策略原理
该策略的运作基于几个关键技术指标和条件的组合:
多时间框架趋势识别:策略首先在1小时时间框架上使用9和21周期的EMA来确定总体趋势方向。当短期EMA在长期EMA之上时,识别为看涨趋势;反之则为看跌趋势。
15分钟时间框架上的入场信号:
- EMA交叉:在确认的趋势方向上,当短期EMA穿过长期EMA时产生交易信号
- VWAP反弹:价格从成交量加权平均价附近反弹并穿过VWAP线时产生信号
指标过滤:
- RSI过滤:多头信号要求RSI在50-70之间,空头信号要求RSI在30-50之间
- 波动性过滤:使用ATR指标确保当前市场波动率处于正常范围内
交易管理:
- 交易时间窗口限制:只在指定的交易时段内执行交易
- 每日信号限制:控制每日交易次数
- 中午12点信号补充:如果上午没有触发信号,在中午12点根据趋势和VWAP关系产生额外信号
风险管理:
- 动态移动止损:基于入场价格和波动率设置初始止损,并根据价格变动动态调整止损位置
策略通过确保交易方向与更大时间框架趋势一致,同时利用中短期价格动量和支撑/阻力确认,提高了交易成功率。移动止损机制则帮助锁定利润并降低单笔交易风险。
策略优势
深入分析该策略代码,我们可以总结出以下明显优势:
多层次确认机制:结合多时间框架分析、趋势方向和动量指标,通过多重确认降低假信号风险。
自适应性强:策略具有多个可调参数,包括EMA周期、RSI水平、ATR范围和交易时间,使其能够适应不同市场条件和交易品种。
风险管理全面:
- 使用ATR指标评估市场波动性,只在正常波动范围内交易
- 实现动态移动止损,可以在保护资金的同时最大化盈利
- 设置交易时间窗口,避开高波动性开盘和收盘时段
交易频率控制:限制每日信号数量,避免过度交易并降低交易成本。
灵活入场策略:提供两种不同的入场信号类型(EMA交叉和VWAP反弹),增加了捕捉市场机会的途径。
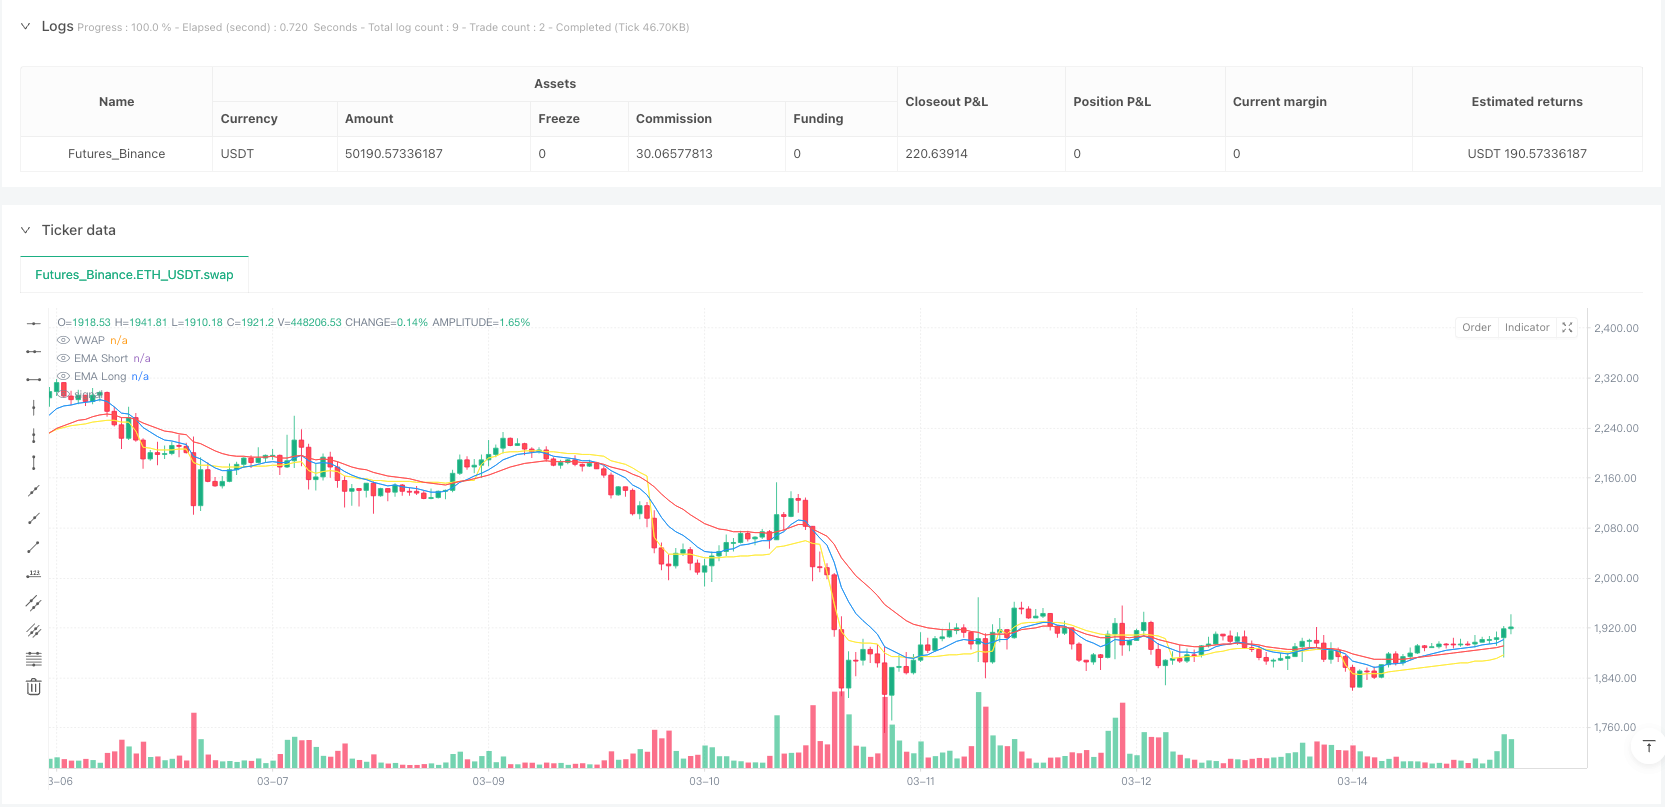
视觉化操作指引:通过图表上的箭头标记和指标线条,使交易者能够直观理解交易信号和市场条件。
智能信号补充:在没有触发主要信号的日子里,策略会在特定时间点(中午12点)基于趋势和价格位置生成备选信号,提高了交易机会捕捉率。
策略风险
尽管该策略具有诸多优势,但仍存在一些潜在风险和挑战:
趋势突然逆转风险:虽然使用多时间框架分析,但市场仍可能出现快速逆转,尤其是在重大新闻或事件发布时,可能导致止损被触发。
- 解决方法:在重要经济数据或公司公告前暂停交易;考虑增加过滤器排除异常波动。
参数优化过度拟合:策略中的多个参数(如EMA周期、RSI阈值等)可能在历史数据上表现良好,但未来可能无法维持相同效果。
- 解决方法:采用稳健参数设置;在不同市场条件和时间段上进行充分回测;定期重新验证参数有效性。
流动性不足风险:在低流动性品种上,滑点和价格缺口可能导致实际入场价格或止损价格远离预期水平。
- 解决方法:优先选择高流动性交易品种;避开低交易量时段;考虑增加流动性过滤条件。
交易成本影响:高频日内策略可能产生大量交易成本,侵蚀实际收益。
- 解决方法:优化信号质量以减少交易次数;增加最小盈利目标要求;考虑将部分日内信号转为隔夜持仓。
时间窗口限制导致机会丢失:严格的交易时间窗口可能错过窗口外的优质信号。
- 解决方法:基于市场特性灵活调整交易窗口;考虑为重要突破信号设置窗口例外机制。
单一指标依赖风险:过度依赖EMA和VWAP可能在某些市场环境下失效,特别是在震荡市场中。
- 解决方法:增加市场结构识别逻辑;在不同市场状态下应用不同的信号生成机制。
策略优化方向
基于对策略代码的深入分析,以下是几个可能的优化方向:
市场环境分类与自适应参数:
- 添加市场类型识别逻辑(趋势、震荡或波动),并根据不同市场状态自动调整参数
- 实现原因:不同市场环境需要不同的交易策略,自适应参数可以提高各种环境下的表现
增强信号过滤机制:
- 整合成交量确认,只在成交量支持的情况下执行信号
- 加入价格形态(如支撑/阻力突破、反转形态)作为额外确认
- 实现原因:成交量和价格结构是趋势强度和可持续性的重要指标,可显著提高信号质量
动态风险管理:
- 基于波动率和趋势强度动态调整仓位大小
- 实现智能止盈目标,根据关键阻力/支撑位或ATR倍数设置
- 实现原因:动态风险管理可以在高确信度信号上增加收益,同时在不确定环境中降低风险敞口
增加市场广度指标:
- 引入行业或大盘趋势分析,确保交易方向与整体市场一致
- 实现原因:个股走势常受大盘和行业趋势影响,与大趋势保持一致可提高成功率
优化中午12点备选信号:
- 为备选信号增加更严格的确认条件,如支撑/阻力测试或关键价格水平突破
- 实现原因:当前备选信号条件相对简单,可能导致质量不如主要信号
机器学习模型整合:
- 使用历史数据训练模型来预测信号成功概率,只执行高概率信号
- 实现原因:机器学习可以识别出人类难以察觉的复杂模式和相关性,提高预测准确性
引入回调入场逻辑:
- 在确认趋势方向后,等待价格回调到关键支撑/阻力位再入场
- 实现原因:回调入场通常提供更好的风险回报比,减少不必要的亏损交易
总结
“多时间框架趋势动量与VWAP反弹交叉量化策略”是一个设计全面的日内交易系统,通过结合多时间框架分析、技术指标确认和严格的风险管理,提供了一种系统化的交易方法。该策略特别强调与更大时间框架趋势保持一致,同时利用短期指标捕捉最佳入场点,通过多层过滤机制减少假信号。
策略的核心优势在于其全面的确认机制和完善的风险管理框架,包括动态移动止损、波动性过滤和交易时段控制。同时,策略也面临趋势逆转、参数优化和市场环境变化等挑战。
通过实施建议的优化措施,特别是市场环境分类与自适应参数、增强信号过滤机制和动态风险管理,该策略有望进一步提高其稳定性和盈利能力。最终,该策略为交易者提供了一个可靠的框架,可以根据个人风险偏好和市场观点进行调整和完善。
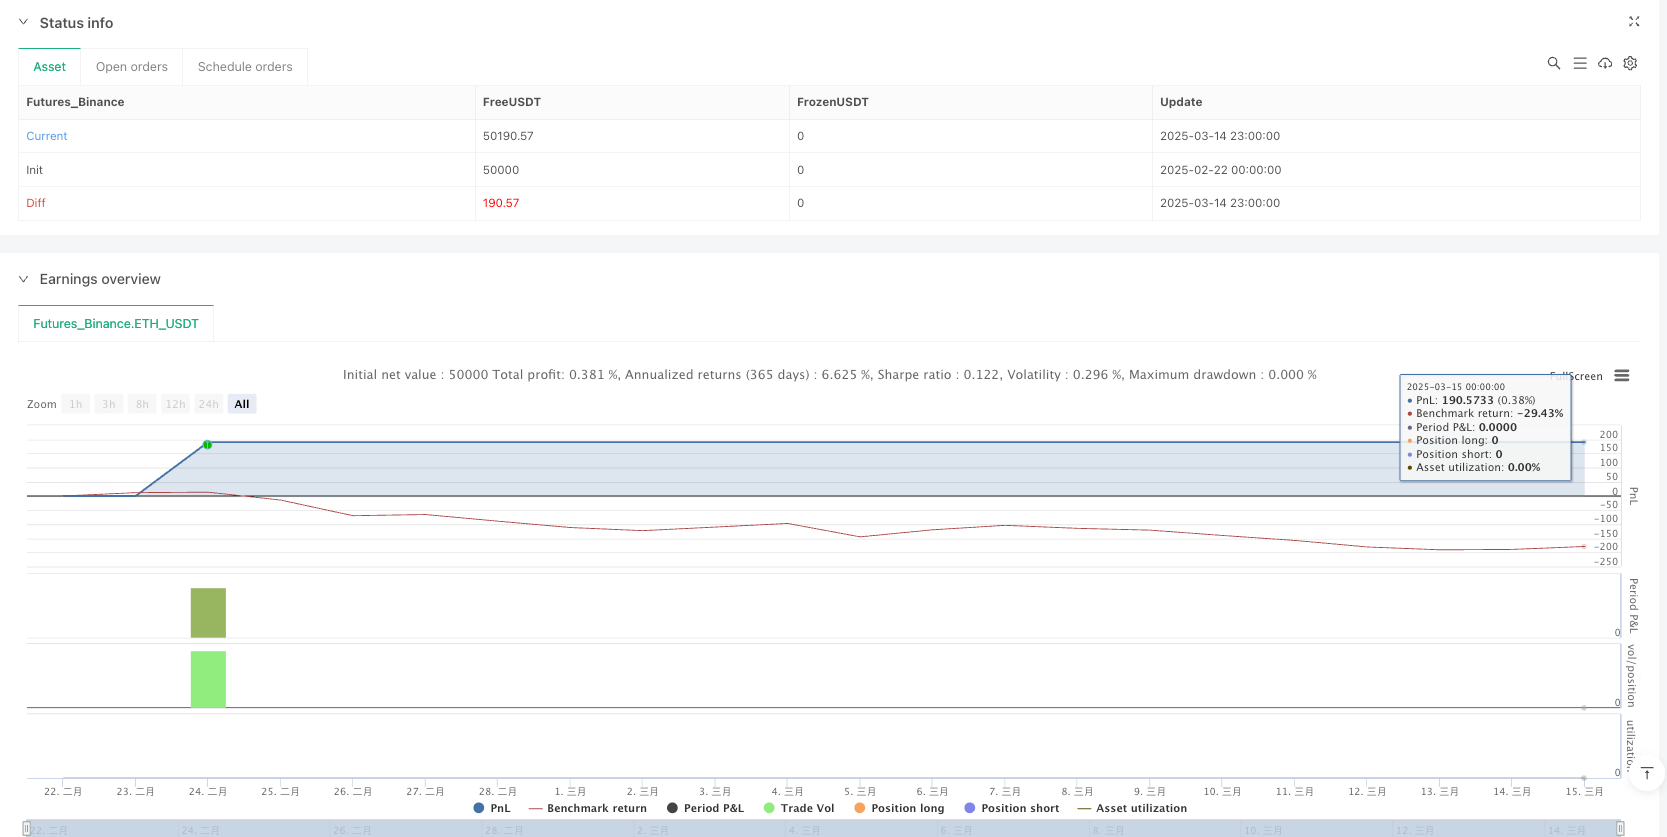
/*backtest
start: 2025-02-22 00:00:00
end: 2025-03-15 00:00:00
period: 1h
basePeriod: 1h
exchanges: [{"eid":"Futures_Binance","currency":"ETH_USDT"}]
*/

//@version=5
strategy("HDFC Bank 95% Accuracy Intraday Strategy", overlay=true, default_qty_type=strategy.percent_of_equity, default_qty_value=100)

// --- Inputs ---
emaShortPeriod = input(9, "Short EMA Period")
emaLongPeriod = input(21, "Long EMA Period")
rsiPeriod = input(14, "RSI Period")
atrPeriod = input(14, "ATR Period")
atrNormalRange = input.float(1.0, "ATR Normal Range %", minval=0.5, maxval=2.0, step=0.1)
trailPercent = input.float(0.5, "Trailing Stop %", minval=0.1, maxval=1.0, step=0.1)
tradeStartHour = input(10, "Trade Start Hour")
tradeStartMin = input(0, "Trade Start Minute")
tradeEndHour = input(14, "Trade End Hour")
tradeEndMin = input(0, "Trade End Minute")

// --- Time and Session Management ---
inTradeWindow = (hour >= tradeStartHour and hour <= tradeEndHour) and (minute >= tradeStartMin and minute <= tradeEndMin) and (hour != tradeEndHour or minute < tradeEndMin)
isNewDay = ta.change(time("D"))
var int signalsToday = 0
if isNewDay
    signalsToday := 0

// --- Multi-Timeframe Trend (1-Hour) ---
emaShort1H = request.security(syminfo.tickerid, "60", ta.ema(close, emaShortPeriod))
emaLong1H = request.security(syminfo.tickerid, "60", ta.ema(close, emaLongPeriod))
bullTrend1H = emaShort1H > emaLong1H
bearTrend1H = emaShort1H < emaLong1H

// --- Indicators (15-Minute) ---
emaShort = ta.ema(close, emaShortPeriod)
emaLong = ta.ema(close, emaLongPeriod)
vwap = ta.vwap(hlc3)
rsi = ta.rsi(close, rsiPeriod)
atr = ta.atr(atrPeriod)
priceRange = atr / close * 100
normalVolatility = priceRange <= atrNormalRange

// --- Entry Conditions ---
emaCrossoverUp = ta.crossover(emaShort, emaLong) and bullTrend1H
emaCrossoverDown = ta.crossunder(emaShort, emaLong) and bearTrend1H
vwapBounceUp = ta.crossover(close, vwap) and ta.lowest(low, 2) < vwap and bullTrend1H and rsi > 50
vwapBounceDown = ta.crossunder(close, vwap) and ta.highest(high, 2) > vwap and bearTrend1H and rsi < 50

longCondition = (emaCrossoverUp or vwapBounceUp) and normalVolatility and rsi > 50 and rsi < 70 and inTradeWindow
shortCondition = (emaCrossoverDown or vwapBounceDown) and normalVolatility and rsi < 50 and rsi > 30 and inTradeWindow

// --- Ensure One Signal Per Day ---
if longCondition or shortCondition
    signalsToday := signalsToday + 1
if signalsToday == 0 and hour == 12 and minute == 0 and inTradeWindow
    longCondition = close > vwap and bullTrend1H and rsi > 50 and normalVolatility
    shortCondition = close < vwap and bearTrend1H and rsi < 50 and normalVolatility

// --- Dynamic Stop-Loss and Trailing Take-Profit ---
var float entryPrice = 0.0
var float trailStop = 0.0
if longCondition
    entryPrice := close
    trailStop := entryPrice - (entryPrice * trailPercent / 100)
if shortCondition
    entryPrice := close
    trailStop := entryPrice + (entryPrice * trailPercent / 100)

strategy.entry("Long", strategy.long, when=longCondition)
strategy.entry("Short", strategy.short, when=shortCondition)

if strategy.position_size > 0
    trailStop := math.max(trailStop, entryPrice - (high - entryPrice) * trailPercent / 100)
    strategy.exit("Trail Long", "Long", trail_points=(entryPrice - trailStop) / syminfo.mintick, trail_offset=(entryPrice - trailStop) / syminfo.mintick)
if strategy.position_size < 0
    trailStop := math.min(trailStop, entryPrice + (entryPrice - low) * trailPercent / 100)
    strategy.exit("Trail Short", "Short", trail_points=(trailStop - entryPrice) / syminfo.mintick, trail_offset=(trailStop - entryPrice) / syminfo.mintick)

// --- Plot Arrows and Indicators ---
plotshape(longCondition, title="Buy Signal", location=location.belowbar, color=color.green, style=shape.triangleup, size=size.normal)
plotshape(shortCondition, title="Sell Signal", location=location.abovebar, color=color.red, style=shape.triangledown, size=size.normal)
plot(emaShort, color=color.blue, title="EMA Short")
plot(emaLong, color=color.red, title="EMA Long")
plot(vwap, color=color.yellow, title="VWAP")