量化多空趋势追踪动态止损策略

2
关注
502
关注者
概述
这是一种基于平均真实波动范围(ATR)和指数移动平均线(EMA)的多空趋势追踪策略。策略通过动态止损和趋势判断,实现对市场趋势的精准捕捉和风险管理。
策略原理
策略核心原理包括以下关键步骤:
- 使用ATR指标计算动态止损点
- 结合EMA判断价格趋势方向
- 通过价格与止损点的相对位置确定交易信号
- 采用海肯阿希(Heikin Ashi)蜡烛图可选择性优化信号识别
主要计算逻辑:
- 动态止损点 = 当前价格 ± (ATR * 敏感系数)
- 趋势判断基于EMA与止损点的交叉
- 当价格突破止损点且EMA交叉时产生交易信号
策略优势
- 动态风险管理:ATR自适应计算止损点,根据市场波动性实时调整
- 趋势追踪精准:EMA快速响应价格变化,捕捉趋势转折点
- 灵活性强:可自定义ATR周期和敏感系数
- 可选海肯阿希蜡烛图,进一步优化信号识别
- 低频交易,减少交易成本
- 适应多市场和多品种
策略风险
- 震荡市场可能产生频繁错误信号
- 参数设置不当可能导致过度交易
- 未考虑基本面因素和突发事件影响
- 回测与实盘存在一定差异
风险控制建议:
- 优化参数,降低敏感系数
- 结合其他指标confirmation
- 设置止损和仓位管理
- 持续监控和动态调整
策略优化方向
- 引入机器学习算法动态优化参数
- 增加多时间周期验证
- 结合其他技术指标组合
- 开发自适应参数选择机制
- 增加风险调整模块
优化目标:提高策略稳定性、降低回撤、提升获利效率
总结
这是一种基于ATR和EMA的动态趋势追踪策略,通过灵活的止损机制和趋势判断,实现相对稳定的市场参与。策略具有良好的适应性和风险管理特征,但仍需持续优化和验证。
策略源码
Pine
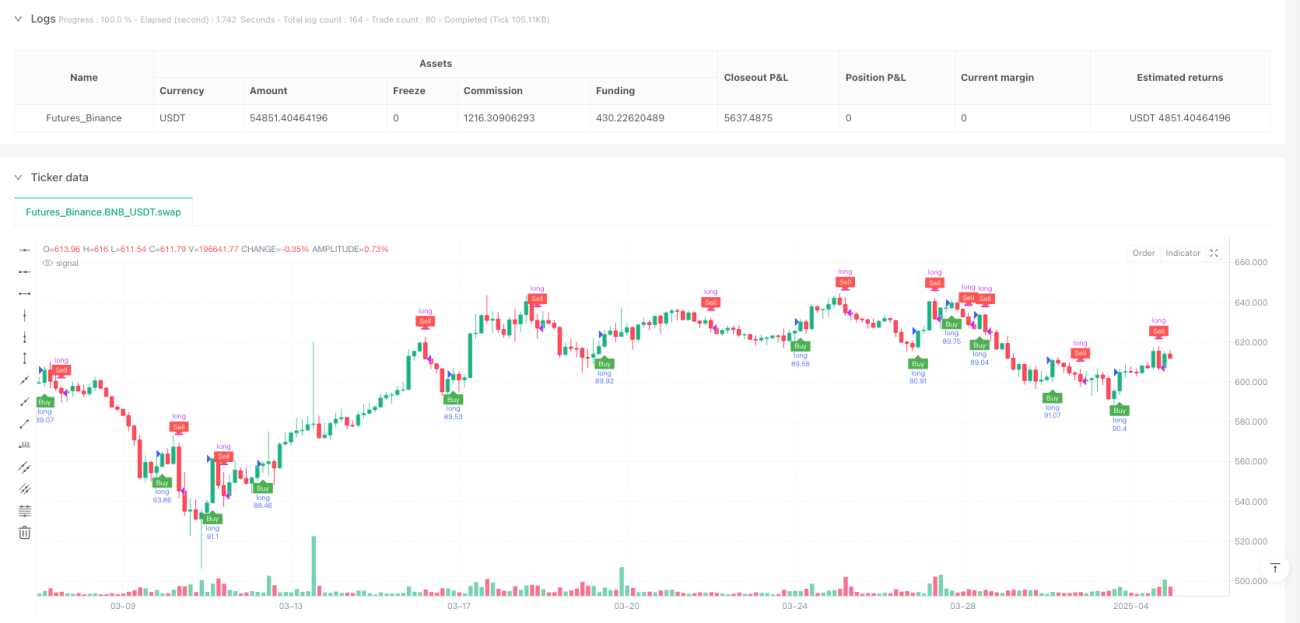
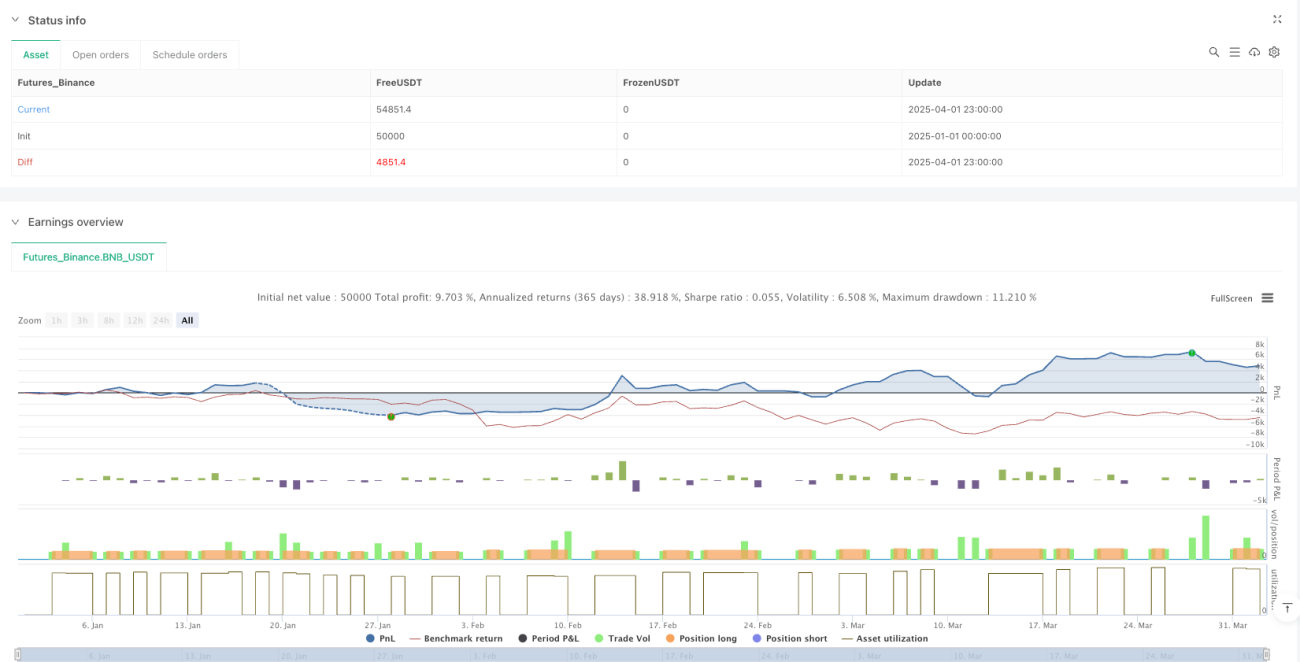
/*backtest
start: 2025-01-01 00:00:00
end: 2025-04-02 00:00:00
period: 3h
basePeriod: 3h
exchanges: [{"eid":"Futures_Binance","currency":"BNB_USDT"}]
*/

//@version=6
strategy("ducanhmaster v1", overlay=true, commission_type=strategy.commission.percent, commission_value=0.1, slippage=3, default_qty_type=strategy.percent_of_equity, default_qty_value=100)

// Inputs策略参数
相关策略
评论
全部评论 (0)
暂无数据
- 1