Higher Timeframe Weighted Moving Average Zone Breakout Quantitative Trading Strategy

Overview
The Higher Timeframe Weighted Moving Average Zone Breakout Quantitative Trading Strategy is a trading system based on price zone breakouts, combining higher timeframe weighted moving averages (WMA) with percentage-based zones to construct trading areas. The strategy generates entry signals by identifying price breakouts above the upper line or below the lower line, and applies staged profit-taking and stop-loss settings to manage risk. The core of the strategy is using weighted moving averages on a higher timeframe to filter out short-term market noise, then building trading zones on the current timeframe, making trading decisions more robust and reliable.
Strategy Principles
The basic principle of this strategy is to use weighted moving averages from a higher timeframe to construct price action zones. The specific implementation steps are as follows:
- First, the strategy calculates weighted moving averages (WMA) of the open, high, low, and close prices, with periods based on the user-defined minimum period parameter (default is 60).
- Then, the strategy transfers these WMA values from a higher timeframe (default is monthly) to the current trading timeframe.
- It calculates the midpoint of the high and low weighted moving averages as the center price.
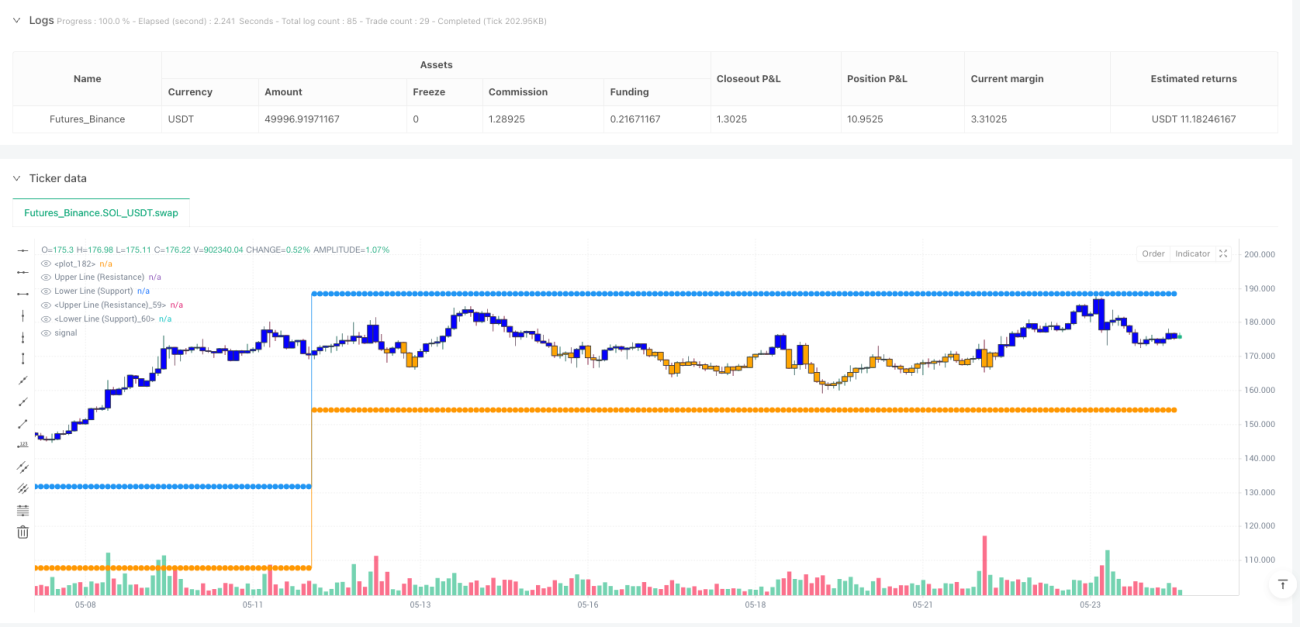
- Based on the center price and a user-defined percentage ratio (default is 0.1 or 10%), it constructs upper (resistance) and lower (support) lines.
- When price breaks above the upper line, a long signal is triggered; when price breaks below the lower line, a short signal is triggered.
- The strategy sets two take-profit targets (default at 10% and 20%), each closing a portion of the position (default 50% each).
- It also sets a stop-loss (default at 5%) to limit potential losses.
The strategy uses visual elements such as background color changes, custom candles, and entry/exit markers to help traders visually identify trading zones and current market conditions. Additionally, the strategy displays the percentage change of the current position with an applied multiplier factor (default is 20) to highlight price movements.
Strategy Advantages
Analyzing the strategy code in depth, we can identify the following significant advantages:
-
Higher Timeframe Filtering: By using weighted moving averages from a higher timeframe, the strategy effectively filters out short-term market noise, capturing more meaningful price movements and reducing false signals.
-
Dynamic Trading Zones: The strategy dynamically constructs trading zones based on price midpoints and percentage ratios, adapting to different market conditions and volatility, avoiding the limitations of fixed support/resistance levels.
-
Clear Entry and Exit Rules: The strategy provides clear entry signals (breakouts above/below lines) and exit rules (staged take-profits and stop-loss), eliminating subjectivity in trading decisions.
-
Integrated Risk Management: The built-in stop-loss and staged take-profit mechanisms help protect capital and lock in profits, making it a complete trading system.
-
Rich Visual Feedback: The strategy provides rich visual elements, including trading zone background colors, percentage change labels, and entry/exit markers, helping traders quickly assess market conditions.
-
Flexible Parameter Settings: Users can adjust multiple parameters based on personal preferences and different market conditions, including timeframes, moving average periods, ratio percentages, take-profit/stop-loss levels, and visual elements.
-
Multi-Timeframe Coordination: The strategy combines the signal quality of higher timeframes with the execution precision of the current timeframe, achieving multi-timeframe coordination.
Strategy Risks
Despite its many advantages, the strategy also has the following potential risks:
-
False Breakout Signals: Price may briefly break through zone boundaries before reverting, leading to false trading signals. To mitigate this risk, consider adding confirmation mechanisms, such as requiring price to hold for a period after breakout, or combining with other indicators for confirmation.
-
Unsuitable for Highly Volatile Markets: In highly volatile markets, price may frequently break through zone boundaries, leading to excessive trading and potential losses. In such cases, increasing the zone ratio or switching to a higher timeframe may help.
-
Fixed Percentage Stop-Loss/Take-Profit Lack Flexibility: Market volatility changes over time, and fixed percentage stop-loss/take-profit may not always be optimal. Consider dynamically adjusting stop-loss/take-profit levels based on volatility indicators such as ATR.
-
Parameter Sensitivity: Strategy performance may be highly sensitive to parameter settings, such as WMA periods, zone ratios, and take-profit/stop-loss percentages. Thorough historical backtesting and parameter optimization are necessary.
-
Over-Optimization Risk: Overfitting to specific historical data may lead to poor future performance. It is recommended to backtest across multiple markets and time periods, and keep parameters relatively stable.
-
Market Trend Change Adaptability: The strategy does not adjust its zones based on new market trends after a breakout, which may lead to incorrect signals in strong trending markets. Consider adding trend filters or dynamically adjusting zones.
Strategy Optimization Directions
Based on in-depth analysis of the code, the strategy can be optimized in the following directions:
-
Add Breakout Confirmation Mechanism: To reduce false breakouts, additional confirmation conditions can be added, such as requiring closing price after breakout, volume confirmation, or cross-verification using other technical indicators (like RSI, MACD).
-
Dynamic Stop-Loss Settings: Replace fixed percentage stop-losses with volatility-based dynamic stop-losses, such as using multiples of ATR (Average True Range) to set stop-loss levels, making the strategy better adapt to different market conditions.
-
Add Trend Filters: Add trend identification components, such as long-term moving averages or ADX indicators, to adjust trading behavior in strong trending markets, for example, only going long in uptrends and short in downtrends.
-
Optimize Entry Timing: The current strategy enters immediately when price breaks through zone boundaries; consider waiting for pullbacks or specific pattern confirmations to improve entry quality.
-
Enhance Money Management Module: Implement more sophisticated position size calculations based on account size, market volatility, and current trade risk, rather than using fixed positions.
-
Add Market State Filtering: Identify market states (such as trending, ranging, or high volatility) and adjust strategy parameters or pause trading based on different market states.
-
Implement Adaptive Parameters: Allow key parameters such as zone ratios, WMA periods, etc., to automatically adjust based on historical volatility or other market characteristics, improving strategy adaptability.
-
Integrate Multi-Timeframe Signals: Not only use higher timeframe WMAs to construct zones, but also analyze price behavior and indicators across multiple timeframes for more comprehensive market analysis and trading decisions.
Summary
The Higher Timeframe Weighted Moving Average Zone Breakout Quantitative Trading Strategy is a well-structured trading system that captures price breakout opportunities by combining higher timeframe weighted moving averages with dynamic zone construction. The strategy's strengths lie in its higher timeframe filtering capability, clear trading rules, built-in risk management mechanisms, and rich visual feedback. However, it also faces challenges such as false breakout signals, parameter sensitivity, and market adaptability.
By implementing the suggested optimization directions, such as adding breakout confirmation mechanisms, dynamic stop-loss settings, trend filtering, and adaptive parameters, the strategy's robustness and profitability can be further enhanced. Most importantly, traders should fully understand the strategy principles and conduct thorough historical backtesting, adjusting parameters according to specific markets and personal risk preferences to fully unleash the strategy's potential.
This zone breakout-based strategy is suitable for medium to long-term traders, especially those seeking to capture significant price breakouts while maintaining risk control. Through continuous optimization and adjustment, this strategy can become a powerful weapon in a trader's toolbox.
- 1