
Overview
The RSI Trend Divergence Strategy Indicator is an advanced quantitative trading tool that leverages the divergence relationship between the Relative Strength Index (RSI) and price action to provide high-probability buy and sell signals. This strategy is specifically optimized for the 30-minute timeframe, using precisely calculated RSI entry and exit levels in conjunction with bullish and bearish divergence signals to effectively identify market turning points. The strategy allows traders to adjust RSI entry and exit parameters according to the characteristics of different markets and timeframes to optimize trading results.
Strategy Principle
The RSI Trend Divergence Strategy is based on the synergistic effect of two core technical indicators:
-
Relative Strength Index (RSI) Overbought/Oversold Levels: The strategy allows users to customize RSI entry and exit levels. In the default settings, the long entry level is 35.0, short entry level is 76.0, long exit level is 80.0, and short exit level is 54.1. These levels were derived through years of experience and testing, optimized specifically for the 30-minute timeframe.
-
RSI Divergence Signals: The strategy identifies two types of divergences:
- Bullish Divergence: Forms when price makes a new low but RSI fails to follow with a new low, indicating weakening downward momentum
- Bearish Divergence: Forms when price makes a new high but RSI fails to follow with a new high, indicating weakening upward momentum
The strategy execution logic is as follows:
- When RSI is below the long entry level (35.0) and a bullish divergence is detected simultaneously, a long entry signal is triggered
- When RSI is above the short entry level (76.0) and a bearish divergence is detected simultaneously, a short entry signal is triggered
- When RSI reaches the long exit level (80.0), long positions are closed
- When RSI reaches the short exit level (54.1), short positions are closed
The system identifies divergences by looking back 5 bars and automatically generates trading signals when conditions are met, significantly reducing the need for manual analysis.
Strategy Advantages
-
High-Precision Signal Filtering: By combining RSI levels and price divergences, the strategy effectively filters out weak signals and only triggers trades at high-probability turning points, increasing the success rate of trades.
-
Strong Customizability: Traders can adjust RSI entry and exit levels according to the characteristics of different markets and timeframes to optimize strategy performance. This flexibility makes it applicable to various trading instruments and time periods.
-
Intuitive Visual Aids: The strategy provides rich visual elements, including:
- Green "BULL" labels for bullish divergences
- Red "BEAR" labels for bearish divergences
- Divergence connection lines visually displaying the relationship between key RSI points
- Background color differentiation for RSI overbought (red), oversold (green), and neutral (gray) zones
-
Automated Trading Potential: Supports integration with external trading platforms through TradingView's Webhook functionality, enabling automated trade execution, reducing human intervention and emotional influence.
-
Open Source Transparency: The strategy code is completely open source, allowing traders to deeply understand its working principles and modify and optimize it according to their needs.
Strategy Risks
-
Market Trend Risk: While this strategy performs well in identifying turning points, it may generate false signals in strongly trending markets. In particular, the reliability of long signals is significantly reduced during strong downtrends or bear markets.
-
Parameter Sensitivity: The setting of RSI entry and exit levels has a major impact on strategy performance. Inappropriate parameter settings may lead to excessive trading or missing important opportunities. The solution is to optimize parameters through backtesting for specific markets and timeframes.
-
Lag Risk: As the strategy uses a lagging indicator (RSI) and needs to wait for divergence formation, it may lead to less than ideal entry points, especially in volatile markets.
-
False Breakout Risk: The market may form false divergence signals leading to erroneous trades. It is recommended to combine other technical indicators or higher timeframe confirmation.
-
Commission and Slippage Impact: The strategy has a default commission setting of 0.1%, but actual commissions and slippage in real trading may differ from the set values, affecting the difference between backtesting results and actual trading performance.
Strategy Optimization Directions
-
Multi-Timeframe Analysis Integration: Extend the strategy into a multi-timeframe analysis system, executing trades only when the trend direction of higher timeframes aligns with the divergence signal. For example, only execute long trades when the daily chart shows an uptrend and the 30-minute chart displays a bullish divergence.
-
Add Volume Filter: Incorporate a volume confirmation mechanism when divergence signals form to improve signal reliability. For instance, check whether the volume shows divergence or confirmation patterns when divergences form.
-
Adaptive RSI Parameters: Develop adaptive algorithms to automatically adjust RSI entry and exit levels based on market volatility, adapting to different market environments.
-
Stop Loss Mechanism Optimization: Currently, the strategy exits trades based only on RSI levels; adding price-based stop-loss mechanisms would limit the maximum loss per trade.
-
Add Market Environment Filtering: Integrate trend identification indicators (such as moving averages or ADX) to execute specific directional trades only in appropriate market environments, avoiding counter-trend trading.
-
Machine Learning Optimization: Utilize machine learning algorithms to analyze historical data, automatically identifying optimal RSI parameters and divergence confirmation conditions to further improve strategy performance.
Summary
The RSI Trend Divergence Strategy Indicator is a powerful quantitative trading tool that effectively identifies market turning points by combining RSI indicators and price divergences. The strategy's most significant advantages are its high customizability and intuitive visual aids, enabling traders to optimize trading decisions according to different market environments.
The core value of the strategy lies in its signal filtering capability, significantly improving the quality of trading signals by triggering trades only when RSI is at specific levels and price divergences occur simultaneously. However, users need to be aware of market trend risks and parameter sensitivity, and find the best parameters for specific markets and timeframes through backtesting.
Through optimization directions such as multi-timeframe analysis, volume confirmation, adaptive parameters, and enhanced risk management mechanisms, the strategy has the potential to further improve its performance and adaptability. For traders seeking technically driven quantitative trading strategies, this is a tool worth in-depth research and application.
/*backtest
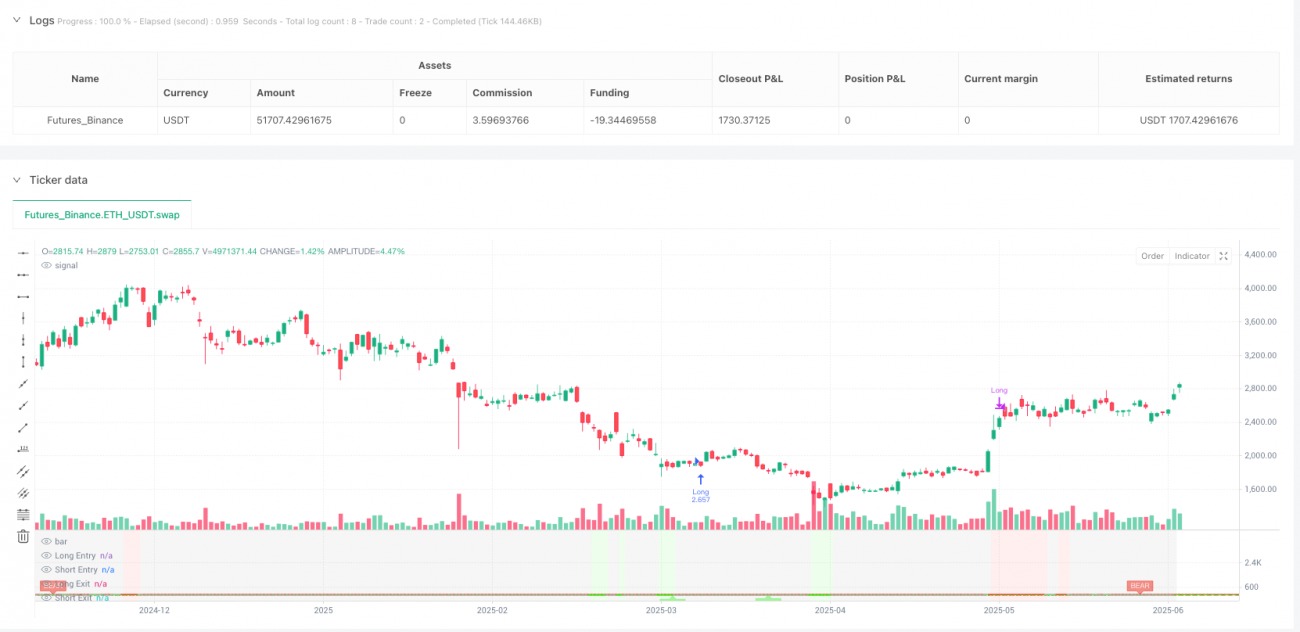
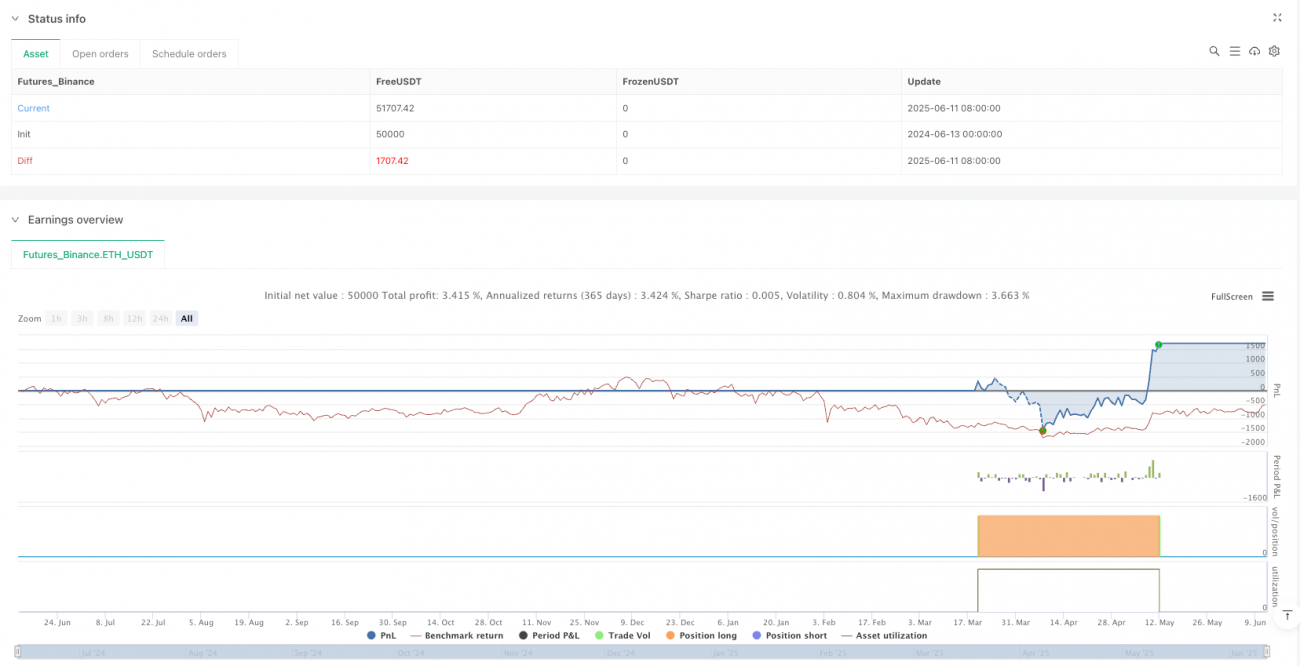
start: 2024-06-13 00:00:00
end: 2025-06-12 00:00:00
period: 1d
basePeriod: 1d
exchanges: [{"eid":"Futures_Binance","currency":"ETH_USDT"}]
*/
//@version=6
strategy(title="RSI Divergence Strategy", shorttitle="RSI Divergence Strategy", overlay=false, default_qty_type=strategy.percent_of_equity, default_qty_value=10, commission_type=strategy.commission.percent, commission_value=0.1, slippage=0, initial_capital=100000, currency=currency.USD, process_orders_on_close=false)
// RSI Settings- 1