
策略概述
该策略是一种基于简单移动平均线(SMA)交叉的量化交易策略,通过快速和慢速移动平均线之间的交叉来识别市场趋势的转变点,并结合固定百分比的止盈止损机制来管理风险和收益。策略核心逻辑简单直观:当快速移动平均线向上穿越慢速移动平均线时产生买入信号,表明市场可能开始呈现上升趋势;当快速移动平均线向下穿越慢速移动平均线时产生卖出信号,表明市场可能开始呈现下降趋势。同时,每笔交易都设置了基于入场价格的止盈和止损水平,以保护资金并锁定利润。
策略原理
该策略的技术原理基于移动平均线作为趋势指标的特性。具体实现细节如下:
- 双均线系统:策略使用两条不同周期的简单移动平均线,默认分别为10周期(快线)和30周期(慢线)。
- 信号生成逻辑:
- 买入信号:当快速SMA上穿慢速SMA时(通过
ta.crossover函数判断) - 卖出信号:当快速SMA下穿慢速SMA时(通过
ta.crossunder函数判断)
- 买入信号:当快速SMA上穿慢速SMA时(通过
- 交易执行机制:
- 买入信号触发时,执行做多入场
- 卖出信号触发时,执行做空入场
- 风险管理系统:
- 止盈设置:按入场价格的固定百分比(默认0.10%)设置获利目标
- 止损设置:按入场价格的固定百分比(默认0.10%)设置最大亏损限制
- 可视化组件:
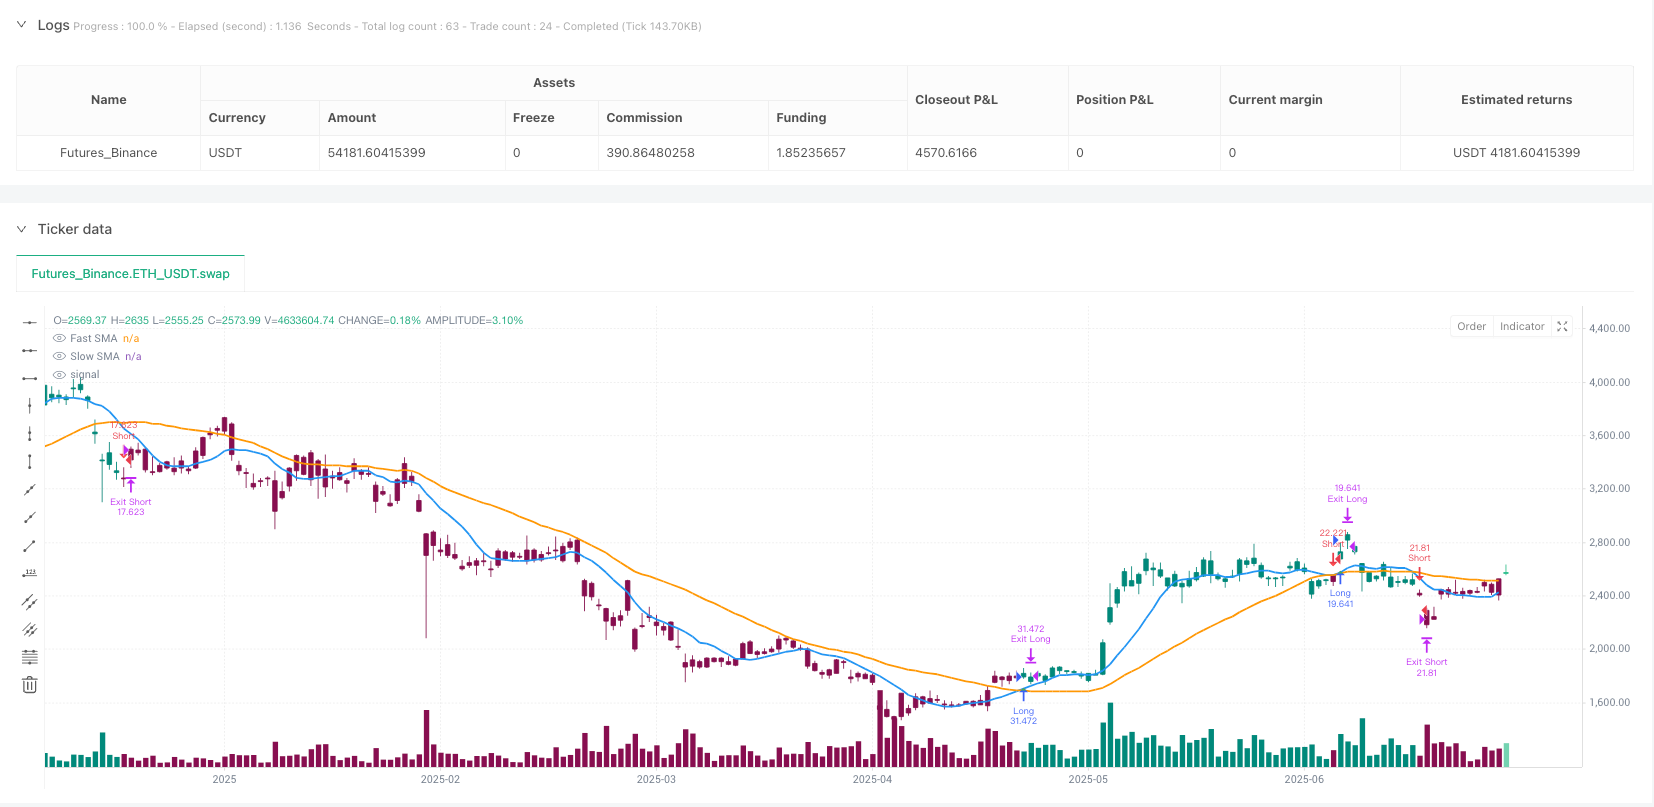
- 双均线绘制:使用不同颜色(蓝色和橙色)和线宽标识快慢均线
- 信号标记:多空信号使用不同形状和颜色的箭头标记
- 柱状图着色:根据当前趋势方向对价格柱进行颜色标记
从代码实现来看,该策略采用了TradingView Pine脚本V6版本,并利用了strategy函数族实现交易逻辑,使用plot和plotshape函数实现可视化,同时设置了alertcondition用于触发交易提醒。
策略优势
分析该策略的代码实现,可以归纳出以下几点显著优势:
- 简洁高效:策略逻辑简单明了,易于理解和实施,不涉及复杂计算,运算效率高。
- 自适应性强:双均线系统可以适应不同市场环境和周期,参数可调节性强。
- 风险控制完善:集成了止盈止损机制,为每笔交易设定明确的退出条件,有效控制单笔交易风险。
- 多市场适用性:代码结构适用于各类交易品种,包括股票、加密货币、外汇和指数等。
- 可视化程度高:提供了清晰的视觉反馈,包括均线走势、入场信号标记和柱状图颜色变化,便于交易者直观理解市场状态。
- 资金管理灵活:采用资金百分比模式进行头寸管理,默认使用100%资金,但可以根据需要调整。
- 全自动化:策略可以完全自动化执行,减少人为干预和情绪因素影响。
- 实时提醒功能:内置交易信号提醒条件,可帮助交易者及时把握市场机会。
策略风险
尽管该策略设计合理,但仍存在以下潜在风险和局限性:
- 震荡市场假信号:在横盘整理或震荡市场中,双均线系统可能产生频繁的交叉信号,导致连续止损。解决方法是增加过滤条件,如趋势确认指标或交易量确认。
- 滞后性问题:作为滞后指标,移动平均线在趋势转折点通常反应较慢,可能错过理想入场点或延迟出场。可以考虑结合领先指标或缩短均线周期来减轻这一问题。
- 固定百分比风险设置不灵活:当前止盈止损设置使用固定百分比,未考虑市场波动性差异。改进方向是引入基于ATR或波动率的动态止损机制。
- 缺乏回撤控制:策略没有设置最大回撤限制或总体风险控制机制。建议添加最大亏损限制或连续亏损次数限制。
- 参数敏感性:双均线周期设置对策略表现影响显著,不同市场和时间框架可能需要不同参数。需要进行充分的参数优化和回测。
- 过度交易风险:在某些市场条件下,策略可能触发过多交易,增加交易成本。可以通过增加交易过滤器或冷却期来控制交易频率。
- 未考虑交易成本:代码中未明确纳入交易手续费和滑点的影响,可能导致回测结果过于乐观。实际应用时应将这些因素纳入考量。
策略优化方向
基于代码分析,该策略可以从以下几个方向进行优化:
- 动态止盈止损:将固定百分比止盈止损替换为基于ATR或历史波动率的动态机制,以适应不同市场条件下的波动性变化。这样做的原因是固定比例在高波动和低波动市场中可能表现不一致。
- 趋势强度过滤:引入ADX或类似指标来衡量趋势强度,只在趋势明确时执行交易,减少震荡市场中的假信号。这能有效提高策略的胜率。
- 交易量确认:添加交易量条件作为交叉信号的辅助确认,提高信号可靠性。交易量往往是趋势真实性的重要佐证。
- 参数自适应机制:开发基于市场条件自动调整均线周期的机制,提高策略适应性。比如在高波动性市场可能需要更长的均线周期。
- 增加再入场逻辑:当止损触发后但趋势信号仍然有效时,设计再入场逻辑以把握持续性趋势。
- 风险管理增强:添加每日最大亏损限制、连续亏损次数限制等风险控制机制,保护账户资金。
- 时间过滤器:针对特定市场添加时间过滤器,避开低流动性或高波动性时段的交易。
- 多时间框架分析:整合更高时间框架的趋势方向作为交易过滤条件,只在多个时间框架趋势一致时进行交易。
- 优化头寸规模管理:根据信号强度、市场波动性或历史胜率动态调整每笔交易的资金比例,而不是固定使用100%的资金。
- 加入平滑算法:考虑使用EMA替代SMA,或者对交叉信号进行平滑处理,减少错误交易信号。
这些优化方向主要针对提高信号质量、增强风险管理和提升策略适应性三个方面,可以根据实际交易需求选择性地实施。
总结
双均线交叉带止盈止损的趋势交易量化策略是一种结合了技术分析经典理论和现代风险管理的交易系统。该策略通过监测快速与慢速移动平均线之间的关系来判断市场趋势,并在关键交叉点产生交易信号,同时为每笔交易设置预定的获利目标和损失限制。
策略的主要优势在于其逻辑简明、易于理解和实施,同时具有良好的可视化效果和风险控制机制。然而,作为一种基于均线的系统,它也面临着信号滞后和震荡市场中假信号频发等典型挑战。
通过引入动态止损机制、趋势强度过滤、多时间框架分析等优化手段,可以显著提升策略的性能和适应性。对于交易者而言,理解策略的运作原理和局限性,结合个人风险偏好进行适当调整,是成功应用该策略的关键。
最后,需要强调的是,任何交易策略都需要在实际应用前进行充分的历史回测和前向验证,并根据不同市场环境和交易品种的特性进行针对性调整。
/*backtest
start: 2024-07-09 00:00:00
end: 2025-07-04 08:00:00
period: 1d
basePeriod: 1d
exchanges: [{"eid":"Futures_Binance","currency":"ETH_USDT"}]
*/

//@version=6
strategy("SMA Crossover Strategy with TP/SL", overlay=true, initial_capital=10000, default_qty_type=strategy.percent_of_equity, default_qty_value=100)

// --- Inputs ---
fast_length = input.int(10, title="Fast SMA Length", minval=1)
slow_length = input.int(30, title="Slow SMA Length", minval=1)
take_profit_percent = input.float(0.10, title="Take Profit (%)", minval=0.01) / 100
stop_loss_percent = input.float(0.10, title="Stop Loss (%)", minval=0.01) / 100

// --- SMA Calculations ---
fast_sma = ta.sma(close, fast_length)
slow_sma = ta.sma(close, slow_length)

// --- Signals ---
buy_signal  = ta.crossover(fast_sma, slow_sma)
sell_signal = ta.crossunder(fast_sma, slow_sma)

// --- Strategy Entries ---
if buy_signal
    strategy.entry("Long", strategy.long)

if sell_signal
    strategy.entry("Short", strategy.short)

// --- Take Profit and Stop Loss Logic ---
long_entry_price  = strategy.position_avg_price
long_tp_price     = long_entry_price * (1 + take_profit_percent)
long_sl_price     = long_entry_price * (1 - stop_loss_percent)

short_entry_price = strategy.position_avg_price
short_tp_price    = short_entry_price * (1 - take_profit_percent)
short_sl_price    = short_entry_price * (1 + stop_loss_percent)

if strategy.position_size > 0
    strategy.exit("Exit Long", from_entry="Long", limit=long_tp_price, stop=long_sl_price)

if strategy.position_size < 0
    strategy.exit("Exit Short", from_entry="Short", limit=short_tp_price, stop=short_sl_price)

// --- Plotting SMAs ---
plot(fast_sma, title="Fast SMA", color=color.blue, linewidth=2)
plot(slow_sma, title="Slow SMA", color=color.orange, linewidth=2)

// --- Plotting Entry Signals ---
plotshape(buy_signal and strategy.position_size[1] <= 0, title="Buy Signal", location=location.belowbar,
     color=color.green, style=shape.triangleup, size=size.small)

plotshape(sell_signal and strategy.position_size[1] >= 0, title="Sell Signal", location=location.abovebar,
     color=color.red, style=shape.triangledown, size=size.small)

// --- Bar Coloring ---
bar_color = fast_sma > slow_sma ? color.teal : fast_sma < slow_sma ? color.maroon : na
barcolor(bar_color)

// --- Alerts ---
alertcondition(buy_signal, title="SMA Crossover Buy", message="Fast SMA crossed above Slow SMA - Buy!")
alertcondition(sell_signal, title="SMA Crossover Sell", message="Fast SMA crossed below Slow SMA - Sell!")