Moving Arerage Squeeze & Divergence Strategy

When Markets Fall Silent, Who Listens for the Coming Storm?
In the world of quantitative trading, there exists an eternal paradox: the quietest moments often breed the most dramatic changes. Like the calm before a storm, when multiple moving averages begin to converge, forming what we call an "adhesion" state, the market is accumulating tremendous energy. Today, we delve deep into a strategy that ingeniously captures this market dynamic—the Fixed MA Adhesion & Divergence Strategy.
This is not merely a combination of technical indicators, but a profound insight into market psychology. It attempts to answer a core question: How do we foresee impending eruptions in market silence?
Strategy Core: Finding Order in Chaos
The design philosophy of this strategy is built upon a key observation: when four moving averages of different periods (5, 10, 20, 30) begin to converge, the market is in a critical state. This state resembles the critical point of phase transition in physics—the final equilibrium before a system undergoes qualitative change.
The strategy quantifies this adhesion state by calculating the moving average bandwidth. When the ratio of the difference between the maximum and minimum MA values to the average MA value falls below a set threshold (default 3%), the system identifies it as an adhesion state. This 3% threshold is not arbitrarily set, but derived from extensive historical data analysis as an optimal parameter that effectively filters market noise while maintaining sensitivity to genuine signals.
More ingeniously, the strategy requires the adhesion state to persist for at least 3 periods before confirmation. This design avoids false signals caused by short-term fluctuations, ensuring that the subsequent monitoring mechanism is only activated when the market truly enters a consolidation state.
Divergence Detection: Capturing Market's Turning Code
After the adhesion state ends, the strategy enters a 5-period observation window, which is the most critical phase of the entire system. During this window, the strategy simultaneously monitors three key elements:
Directional Breakthrough in MA Alignment: Bullish signals require a perfect arrangement of MA5 > MA10 > MA20 > MA30, representing consistent bullish sentiment from short-term to long-term. Conversely, bearish signals require the complete opposite arrangement. This strict alignment requirement ensures signal reliability and avoids false breakouts during sideways markets.
Strong Divergence Confirmation: When the MA bandwidth expands beyond the 5% threshold, it indicates the market has transitioned from a dormant to an active state. This 5% divergence threshold is carefully calibrated to capture meaningful market changes without being misled by normal market fluctuations.
Volume Synergy Verification: The strategy requires volume to exceed 1.5 times the 20-period average, ensuring that price movements are supported by genuine market participation. Price breakouts without volume confirmation are often unsustainable, a point particularly crucial in quantitative trading.
Risk Management: Finding Certainty in Uncertainty
Excellent trading strategies must not only identify opportunities but also manage risks. This strategy employs multi-layered risk control mechanisms:
Fixed Stop-Loss and Dynamic Take-Profit: The 2% stop-loss setting provides a clear risk boundary for each trade, while the 4% take-profit target ensures a favorable risk-reward ratio. More importantly, the strategy offers a trailing stop option, allowing profitable trades to continue participating in favorable market trends while protecting accrued profits.
Strict Position Control: The strategy ensures holding only one directional position at any time, avoiding complex hedging situations and potential capital management confusion.
Practical Considerations: Bridging Theory and Reality
In my years of quantitative trading practice, I've found that adhesion-based strategies perform exceptionally well in certain market environments, particularly on financial instruments with distinct trending characteristics, such as major currency pairs and stock index futures.
However, the strategy has its limitations. In high-frequency volatile markets, the 5% divergence threshold might be too conservative, causing missed rapid trading opportunities. Similarly, in long-term sideways markets, the strategy might generate numerous false signals.
From a deeper perspective, this strategy is actually trading market "state transitions"—from low volatility states to high volatility states. Such transitions often accompany new information entry or market sentiment changes, which is precisely what trend traders hope to capture.
Future Outlook: The Evolution Direction of Algorithmic Trading
With the development of machine learning and artificial intelligence technologies, traditional technical analysis strategies are undergoing profound transformations. Adhesion strategies like this might combine with more complex pattern recognition algorithms to form more intelligent trading systems.
For example, we could introduce sentiment analysis data to enhance volume confirmation mechanisms, or use deep learning models to dynamically adjust adhesion and divergence threshold parameters. These improvements would enable strategies to better adapt to constantly changing market environments.
Ultimately, successful quantitative trading is not merely mechanical application of technical indicators, but an embodiment of profound market understanding and reverent risk awareness. This Fixed MA Adhesion & Divergence Strategy provides us with an excellent starting point, but its true value lies in how we continuously refine and evolve it in practice.
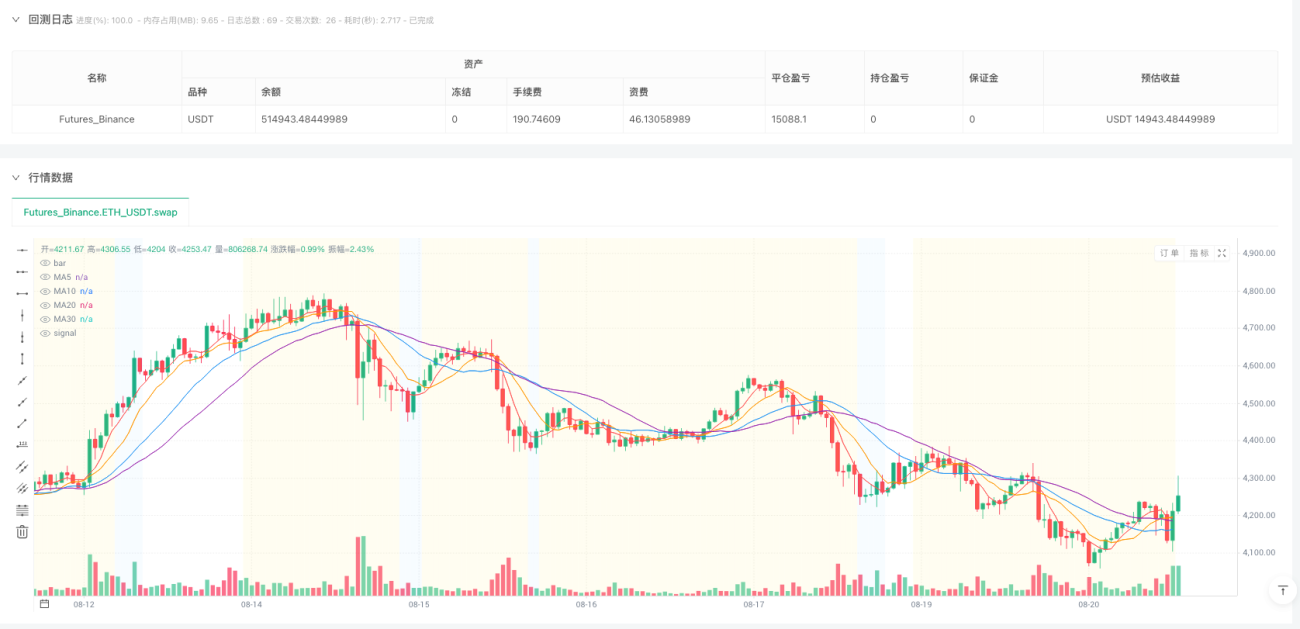
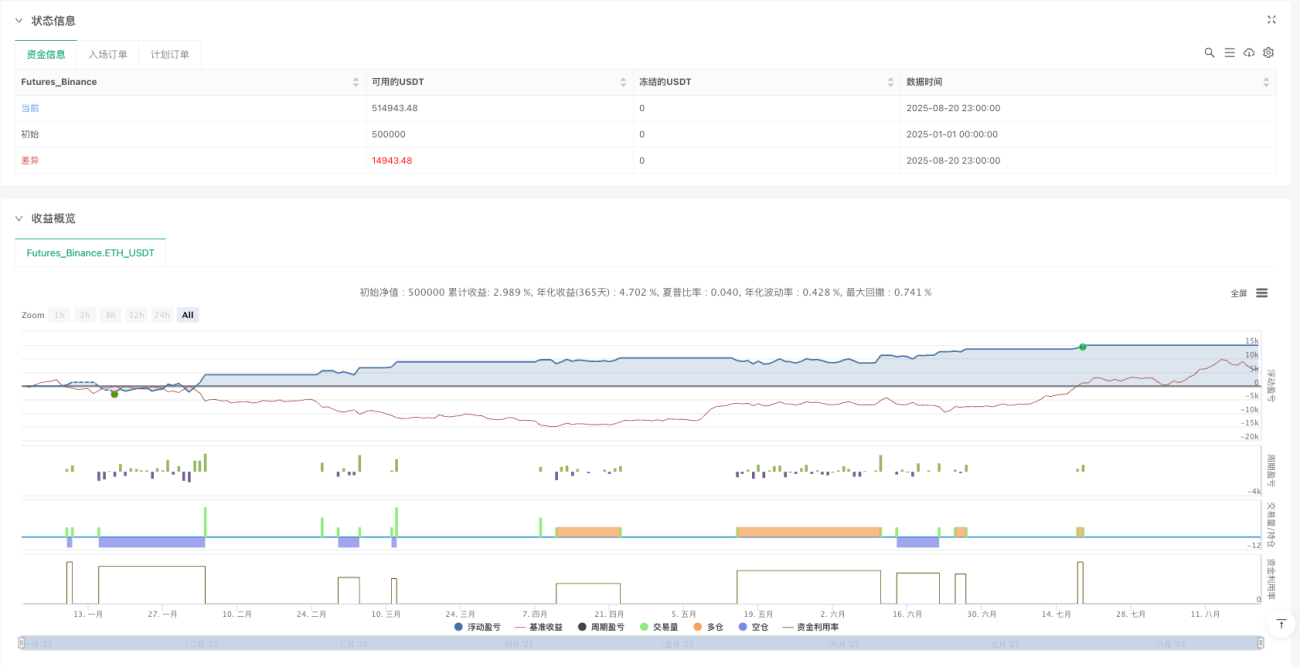
/*backtest
start: 2025-01-01 00:00:00
end: 2025-08-21 00:00:00
period: 1h
basePeriod: 1h
exchanges: [{"eid":"Futures_Binance","currency":"ETH_USDT","balance":500000}]
*/

//@version=5
strategy("均线粘合发散策略", shorttitle="Fixed MA Squeeze & Divergence", overlay=true, default_qty_value=10)

// ===== 参数设置 =====- 1