发明者量化API文档
Author: 小小梦, Created: 2017-11-27 09:05:08, Updated: 2023-07-12 16:47:31e: ‘hour’,count: 3, text: ‘3h’}, {type: ‘hour’, count: 8, text: ‘8h’}, {type: ‘all’,text: ‘All’}],
selected: 0,
inputEnabled: false
},
// 坐标轴横轴即:x轴,当前设置的类型是:时间
xAxis: { type: ‘datetime’},
// 坐标轴纵轴即:y轴,默认数值随数据大小调整
yAxis : {
// 标题
title: {text: ‘差价’},
// 是否启用右边纵轴
opposite: false
},
// 数据系列,该属性保存的是各个数据系列(线,K线图,标签等…)
series : [
// 索引为0,data数组内存放的是该索引系列的数据
{name : “line1”, id : “线1,buy1Price”, data : []},
// 索引为1,设置了dashStyle:'shortdash’即:设置虚线
{name : “line2”, id : “线2,lastPrice”, dashStyle : ‘shortdash’, data : []}
]
}
function main(){
// 调用Chart函数,初始化图表
var ObjChart = Chart(chart)
// 清空
ObjChart.reset()
while(true){
// 获取本次轮询的时间戳,即一个毫秒的时间戳。用来确定写入到图表的X轴的位置
var nowTime = new Date().getTime()
// 获取行情数据
var ticker = _C(exchange.GetTicker)
// 从行情数据的返回值取得买一价
var buy1Price = ticker.Buy
// 取得最后成交价,为了2条线不重合在一起,我们加1
var lastPrice = ticker.Last + 1
// 用时间戳作为X值,买一价作为Y值传入索引0的数据序列
ObjChart.add(0, [nowTime, buy1Price])
// 同上
ObjChart.add(1, [nowTime, lastPrice])
Sleep(2000)
}
}
```python
import time
chart = {
    "__isStock" : True,
    "tooltip" : {"xDateFormat" : "%Y-%m-%d %H:%M:%S, %A"},
    "title" : {"text" : "差价分析图"},
    "rangeSelector" : {
        "buttons" : [{"type": "count", "count": 1, "text": "1h"}, {"type": "hour", "count": 3, "text": "3h"}, {"type": "hour", "count": 8, "text": "8h"}, {"type": "all", "text": "All"}],
        "selected": 0,
        "inputEnabled": False
    },
    "xAxis": {"type": "datetime"},
    "yAxis": {
        "title": {"text": "差价"},
        "opposite": False
    },
    "series": [{
        "name": "line1", "id": "线1,buy1Price", "data": []
    }, {
        "name": "line2", "id": "线2,lastPrice", "dashStyle": "shortdash", "data": []
    }]
}
def main():
    ObjChart = Chart(chart)
    ObjChart.reset()
    while True:
        nowTime = time.time() * 1000
        ticker = exchange.GetTicker()
        buy1Price = ticker["Buy"]
        lastPrice = ticker["Last"] + 1
        ObjChart.add(0, [nowTime, buy1Price])
        ObjChart.add(1, [nowTime, lastPrice])
        Sleep(2000)
void main() {
    // C++编写策略时,尽量不要声明非基础类型的全局变量,所以图表配置对象声明在main函数内
    json chart = R"({
        "__isStock" : true,
        "tooltip" : {"xDateFormat" : "%Y-%m-%d %H:%M:%S, %A"},
        "title" : {"text" : "差价分析图"},
        "rangeSelector" : {
            "buttons" : [{"type": "count", "count": 1, "text": "1h"}, {"type": "hour", "count": 3, "text": "3h"}, {"type": "hour", "count": 8, "text": "8h"}, {"type": "all", "text": "All"}],
            "selected": 0,
            "inputEnabled": false
        },
        "xAxis": {"type": "datetime"},
        "yAxis": {
            "title": {"text": "差价"},
            "opposite": false
        },
        "series": [{
            "name": "line1", "id": "线1,buy1Price", "data": []
        }, {
            "name": "line2", "id": "线2,lastPrice", "dashStyle": "shortdash", "data": []
        }]
    })"_json;
    auto ObjChart = Chart(chart);
    ObjChart.reset();
    while(true) {
        auto nowTime = Unix() * 1000;
        auto ticker = exchange.GetTicker();
        auto buy1Price = ticker.Buy;
        auto lastPrice = ticker.Last + 1.0;
        ObjChart.add(0, {nowTime, buy1Price});
        ObjChart.add(1, {nowTime, lastPrice});
        Sleep(2000);
    }
}
三角函数曲线画图例子:
// 用于初始化图表的对象
var chart = {
    // 图表标题
    title: {text: "line数值触发 plotLines 值"},
    // Y轴相关设置
    yAxis: {
        // 垂直于Y轴的水平线,用作触发线,是一个结构数组,可以设置多条触发线
        plotLines: [{
            // 触发线的值,设置多少这条线就在相应的数值位置显示
            value: 0,
            // 设置触发线的颜色
            color: 'red',
            // 宽度
            width: 2,
            // 显示的标签
            label: {
                // 标签文本
                text: '触发值',
                // 标签位置居中
                align: 'center'
            }
        }]
    },
    // X轴相关设置,这里设置类型是时间轴
    xAxis: {type: "datetime"},
    series: [
        {name: "sin", type: "spline", data: []},
        // 这个是比较重要的数据系列,可以设置多个数据系列,根据数组索引控制
        {name: "cos", type: "spline", data: []}
    ]
}
function main(){
    // 圆周率
    var pi = 3.1415926535897
    // 用于记录时间戳的变量
    var time = 0
    // 角度
    var angle = 0
    // 坐标y值,用于接收正弦值、余弦值
    var y = 0
    // 调用API接口用chart对象初始化图表
    var objChart = Chart(chart)
    // 初始,清空图表
    objChart.reset()
    // 设置触发线的值为1
    chart.yAxis.plotLines[0].value = 1
    // 循环
    while(true){
        // 获取当前时刻的时间戳
        time = new Date().getTime()
        // 每500ms角度angle增加5度,计算正弦值
        y = Math.sin(angle * 2 * pi / 360)
        // 把计算出来的y值写入图表相应索引的数据系列,add函数的第一个参数为指定的数据系列索引
        objChart.add(0, [time, y])
        // 计算余弦值
        y = Math.cos(angle * 2 * pi / 360)
        objChart.add(1, [time, y])
        // 增加5度
        angle += 5
        // 暂停5秒,以免画图太频繁,数据增长过快
        Sleep(5000)
    }
}
import math
import time
chart = {
    "title": {"text": "line数值触发 plotLines 值"},
    "yAxis": {
        "plotLines": [{
            "value": 0,
            "color": "red",
            "width": 2,
            "label": {
                "text": "触发值",
                "align": "center"
            }
        }]
    },
    "xAxis": {"type": "datetime"},
    "series": [{"name": "sin", "type": "spline", "data": []},
               {"name": "cos", "type": "spline", "data": []}]
}
def main():
    pi = 3.1415926535897
    ts = 0
    angle = 0
    y = 0
    objChart = Chart(chart)
    objChart.reset()
    chart["yAxis"]["plotLines"][0]["value"] = 1
    while True:
        ts = time.time() * 1000
        y = math.sin(angle * 2 * pi / 360)
        objChart.add(0, [ts, y])
        y = math.cos(angle * 2 * pi / 360)
        objChart.add(1, [ts, y])
        angle += 5
        Sleep(5000)
void main() {
    json chart = R"({
        "title": {"text": "line数值触发 plotLines 值"},
        "yAxis": {
            "plotLines": [{
                "value": 0,
                "color": "red",
                "width": 2,
                "label": {
                    "text": "触发值",
                    "align": "center"
                }
            }]
        },
        "xAxis": {"type": "datetime"},
        "series": [{"name": "sin", "type": "spline", "data": []},
                   {"name": "cos", "type": "spline", "data": []}]
    })"_json;

    auto pi = 3.1415926535897;
    auto ts = 0;
    auto angle = 0.0;
    auto y = 0.0;
    auto objChart = Chart(chart);
    objChart.reset();
    chart["yAxis"]["plotLines"][0]["value"] = 1;
    while(true) {
        ts = Unix() * 1000;
        y = sin(angle * 2 * pi / 360);
        objChart.add(0, {ts, y});
        y = cos(angle * 2 * pi / 360);
        objChart.add(1, {ts, y});
        angle += 5;
        Sleep(5000);
    }
}
C++策略中Chart函数也可以使用编码过的字符串配置图表:
void main () {
    Chart c = Chart(R"EOF({"chart":{"type":"line"},"title":{"text":"简单图表"},"xAxis":{"title":{"text":"Date"}},"yAxis":{"title":{"text":"Number"}},"series":[{"name":"number","data":[]}]})EOF");
    c.reset();
    for (size_t i = 0; i < 10; i++) {
        // sprintf比如int64在32位与64位下有不同的参数, 所以最好跟平台有关的类型用toString变成字符串再传进去
        c.add(0, format("[%s, %d]", toString(Unix() + i).c_str(), rand() % 100));
    }
}
)
- 使用混合图表的复杂例子 JavaScript策略地址
/*backtest
start: 2020-03-11 00:00:00
end: 2020-04-09 23:59:00
period: 1d
exchanges: [{"eid":"Bitfinex","currency":"BTC_USD"}]
*/

var chartCfg = {
    subtitle: {
        text: "subtitle",
    },
    yAxis: [{
        height: "40%",
        lineWidth: 2,
        title: {
            text: 'PnL',
        },
        tickPixelInterval: 20,
        minorGridLineWidth: 1,
        minorTickWidth: 0,
        opposite: true,
        labels: {
            align: "right",
            x: -3,
        }
    }, {
        title: {
            text: 'Profit',
        },
        top: "42%",
        height: "18%",
        offset: 0,
        lineWidth: 2
    }, {
        title: {
            text: 'Vol',
        },
        top: '62%',
        height: '18%',
        offset: 0,
        lineWidth: 2
    }, {
        title: {
            text: 'Asset',
        },
        top: '82%',
        height: '18%',
        offset: 0,
        lineWidth: 2
    }],
    series: [{
        name: 'PnL',
        data: [],
        id: 'primary',
        tooltip: {
            xDateFormat: '%Y-%m-%d %H:%M:%S'
        },
        yAxis: 0
    }, {
        type: 'column',
        lineWidth: 2,
        name: 'Profit',
        data: [],
        yAxis: 1,
    }, {
        type: 'column',
        name: 'Trade',
        data: [],
        yAxis: 2
    }, {
        type: 'area',
        step: true,
        lineWidth: 0,
        name: 'Long',
        data: [],
        yAxis: 2
    }, {
        type: 'area',
        step: true,
        lineWidth: 0,
        name: 'Short',
        data: [],
        yAxis: 2
    }, {
        type: 'line',
        step: true,
        color: '#5b4b00',
        name: 'Asset',
        data: [],
        yAxis: 3
    }, {
        type: 'pie',
        innerSize: '70%',
        name: 'Random',
        data: [],
        center: ['3%', '6%'],
        size: '15%',
        dataLabels: {
            enabled: false
        },
        startAngle: -90,
        endAngle: 90,
    }],
};

function main() {
    let c = Chart(chartCfg);
    let preTicker = null;
    while (true) {
        let t = exchange.GetTicker();

        c.add(0, [t.Time, t.Last]); // PnL
        c.add(1, [t.Time, preTicker ? t.Last - preTicker.Last : 0]); // profit
        let r = Math.random();
        var pos = parseInt(t.Time/86400);
        c.add(2, [t.Time, pos/2]); // Vol
        c.add(3, [t.Time, r > 0.8 ? pos : null]); // Long
        c.add(4, [t.Time, r < 0.8 ? -pos : null]); // Short
        c.add(5, [t.Time, Math.random() * 100]); // Asset
        // update pie
        chartCfg.series[chartCfg.series.length-1].data = [
            ["A", Math.random()*100],
            ["B", Math.random()*100],
         ];
        c.update(chartCfg)
        preTicker = t;
    }
}
'''backtest
start: 2020-03-11 00:00:00
end: 2020-04-09 23:59:00
period: 1d
exchanges: [{"eid":"Bitfinex","currency":"BTC_USD"}]
'''

import random

chartCfg = {
    "subtitle": {
        "text": "subtitle"
    },
    "yAxis": [{
        "height": "40%",
        "lineWidth": 2,
        "title": {
            "text": 'PnL'
        },
        "tickPixelInterval": 20,
        "minorGridLineWidth": 1,
        "minorTickWidth": 0,
        "opposite": True,
        "labels": {
            "align": "right",
            "x": -3
        }
    }, {
        "title": {
            "text": 'Profit'
        },
        "top": "42%",
        "height": "18%",
        "offset": 0,
        "lineWidth": 2
    }, {
        "title": {
            "text": 'Vol'
        },
        "top": '62%',
        "height": '18%',
        "offset": 0,
        "lineWidth": 2
    }, {
        "title": {
            "text": 'Asset'
        },
        "top": '82%',
        "height": '18%',
        "offset": 0,
        "lineWidth": 2
    }],
    "series": [{
        "name": 'PnL',
        "data": [],
        "id": 'primary',
        "tooltip": {
            "xDateFormat": '%Y-%m-%d %H:%M:%S'
        },
        "yAxis": 0
    }, {
        "type": 'column',
        "lineWidth": 2,
        "name": 'Profit',
        "data": [],
        "yAxis": 1
    }, {
        "type": 'column',
        "name": 'Trade',
        "data": [],
        "yAxis": 2
    }, {
        "type": 'area',
        "step": True,
        "lineWidth": 0,
        "name": 'Long',
        "data": [],
        "yAxis": 2
    }, {
        "type": 'area',
        "step": True,
        "lineWidth": 0,
        "name": 'Short',
        "data": [],
        "yAxis": 2
    }, {
        "type": 'line',
        "step": True,
        "color": '#5b4b00',
        "name": 'Asset',
        "data": [],
        "yAxis": 3
    }, {
        "type": 'pie',
        "innerSize": '70%',
        "name": 'Random',
        "data": [],
        "center": ['3%', '6%'],
        "size": '15%',
        "dataLabels": {
            "enabled": False
        },
        "startAngle": -90,
        "endAngle": 90
    }]
}

def main():
    c = Chart(chartCfg)
    preTicker = None
    while True:
        t = exchange.GetTicker()
        c.add(0, [t["Time"], t["Last"]])
        profit = t["Last"] - preTicker["Last"] if preTicker else 0
        c.add(1, [t["Time"], profit])
        r = random.random()
        pos = t["Time"] / 86400
        c.add(2, [t["Time"], pos / 2])
        long = pos if r > 0.8 else None
        c.add(3, [t["Time"], long])
        short = -pos if r < 0.8 else None
        c.add(4, [t["Time"], short])
        c.add(5, [t["Time"], random.random() * 100])

        # update pie
        chartCfg["series"][len(chartCfg["series"]) - 1]["data"] = [
            ["A", random.random() * 100],
            ["B", random.random() * 100]
        ]
        c.update(chartCfg)
        preTicker = t
/*backtest
start: 2020-03-11 00:00:00
end: 2020-04-09 23:59:00
period: 1d
exchanges: [{"eid":"Bitfinex","currency":"BTC_USD"}]
*/

void main() {
    json chartCfg = R"({
        "subtitle": {
            "text": "subtitle"
        },
        "yAxis": [{
            "height": "40%",
            "lineWidth": 2,
            "title": {
                "text": "PnL"
            },
            "tickPixelInterval": 20,
            "minorGridLineWidth": 1,
            "minorTickWidth": 0,
            "opposite": true,
            "labels": {
                "align": "right",
                "x": -3
            }
        }, {
            "title": {
                "text": "Profit"
            },
            "top": "42%",
            "height": "18%",
            "offset": 0,
            "lineWidth": 2
        }, {
            "title": {
                "text": "Vol"
            },
            "top": "62%",
            "height": "18%",
            "offset": 0,
            "lineWidth": 2
        }, {
            "title": {
                "text": "Asset"
            },
            "top": "82%",
            "height": "18%",
            "offset": 0,
            "lineWidth": 2
        }],
        "series": [{
            "name": "PnL",
            "data": [],
            "id": "primary",
            "tooltip": {
                "xDateFormat": "%Y-%m-%d %H:%M:%S"
            },
            "yAxis": 0
        }, {
            "type": "column",
            "lineWidth": 2,
            "name": "Profit",
            "data": [],
            "yAxis": 1
        }, {
            "type": "column",
            "name": "Trade",
            "data": [],
            "yAxis": 2
        }, {
            "type": "area",
            "step": true,
            "lineWidth": 0,
            "name": "Long",
            "data": [],
            "yAxis": 2
        }, {
            "type": "area",
            "step": true,
            "lineWidth": 0,
            "name": "Short",
            "data": [],
            "yAxis": 2
        }, {
            "type": "line",
            "step": true,
            "color": "#5b4b00",
            "name": "Asset",
            "data": [],
            "yAxis": 3
        }, {
            "type": "pie",
            "innerSize": "70%",
            "name": "Random",
            "data": [],
            "center": ["3%", "6%"],
            "size": "15%",
            "dataLabels": {
                "enabled": false
            },
            "startAngle": -90,
            "endAngle": 90
        }]
    })"_json;

    Chart c = Chart(chartCfg);
    Ticker preTicker;
    while(true) {
        auto t = exchange.GetTicker();
        c.add(0, {t.Time, t.Last});
        auto profit = preTicker.Valid ? t.Last - preTicker.Last : 0;
        c.add(1, {t.Time, profit});
        auto r = rand() % 100;
        auto pos = t.Time / 86400.0;
        c.add(2, {t.Time, pos / 2.0});
        auto longPos = r > 0.8 ? pos : NULL;
        c.add(3, {t.Time, longPos});
        auto shortPos = r < 0.8 ? -pos : NULL;
        c.add(4, {t.Time, shortPos});
        c.add(5, {t.Time, rand() % 100});

        // update pie
        json pie = R"([["A", 0], ["B", 0]])"_json;
        pie[0][1] = rand() % 100;
        pie[1][1] = rand() % 100;
        chartCfg["series"][chartCfg["series"].size() - 1]["data"] = pie;

        c.update(chartCfg);
        preTicker = t;
    }
}
图表中pie类型的图是没有时间轴的图表,在更新数据时需要直接更新图表配置。例如以上范例中的代码,更新数据后使用c.update(chartCfg)更新图表,如下所示:
    // update pie
    chartCfg.series[chartCfg.series.length-1].data = [
        ["A", Math.random()*100],
        ["B", Math.random()*100],
    ];
    c.update(chartCfg)
    # update pie
    chartCfg["series"][len(chartCfg["series"]) - 1]["data"] = [
        ["A", random.random() * 100],
        ["B", random.random() * 100]
    ]
    c.update(chartCfg)
    // update pie
    json pie = R"([["A", 0], ["B", 0]])"_json;
    pie[0][1] = rand() % 100;
    pie[1][1] = rand() % 100;
    chartCfg["series"][chartCfg["series"].size() - 1]["data"] = pie;
    c.update(chartCfg);
运行结果:
https://www.fmz.com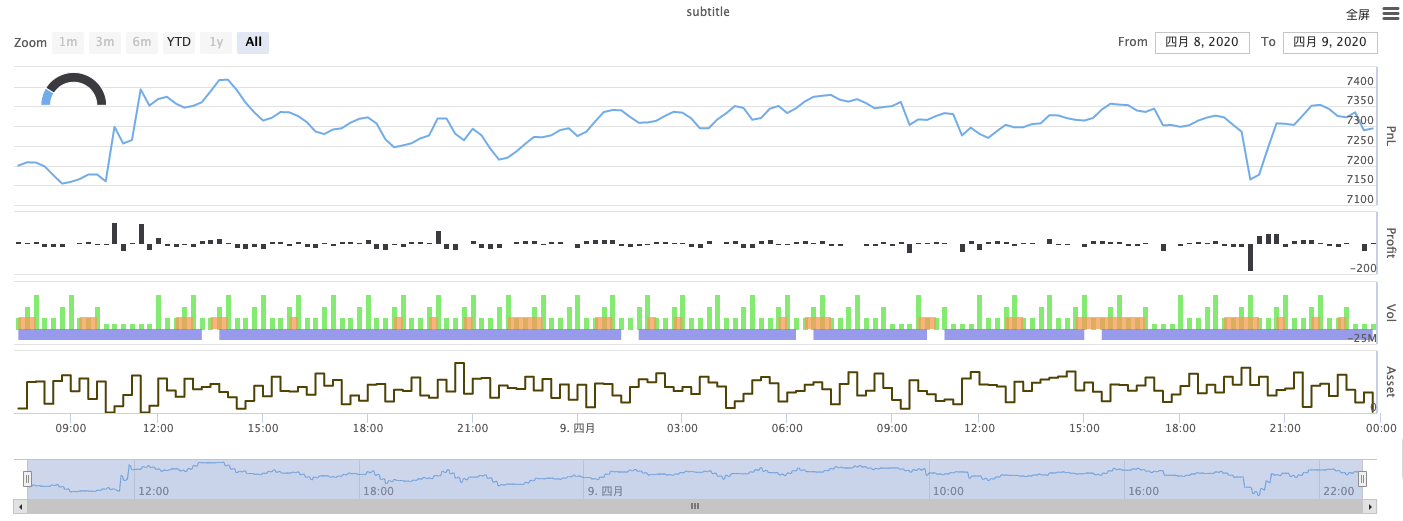
KLineChart(…)
KLineChart(chartCfg),该函数用于使用类似Pine语言的画图方式进行策略运行时的自定义画图,策略自定义画图只能使用KLineChart()方式或者Chart()方式中的一种。
参考代码:
function main() {
    // 调用KLineChart函数创建图表控制对象c
    let c = KLineChart({
        overlay: true
    })

    // 使用现货交易所对象测试,获取K线数据。如果使用期货交易所对象测试,需要先设置合约
    let bars = exchange.GetRecords()
    if (!bars) {
        return
    }

    bars.forEach(function(bar, index) {
        c.begin(bar)
        c.barcolor(bar.Close > bar.Open ? 'rgba(255, 0, 0, 0.2)' : 'rgba(0, 0, 0, 0.2)')
        if (bar.Close > bar.Open) {
            c.bgcolor('rgba(0, 255, 0, 0.5)')
        }
        let h = c.plot(bar.High, 'high')
        let l = c.plot(bar.Low, 'low')

        c.fill(h, l, {
            color: bar.Close > bar.Open ? 'rgba(255, 0, 0, 0.2)' : 'rgba(255, 0, 0, 0.2)'
        })
        c.hline(bar.High)
        c.plotarrow(bar.Close - bar.Open)
        c.plotshape(bar.Low, {
            style: 'diamond'
        })
        c.plotchar(bar.Close, {
            char: 'X'
        })
        c.plotcandle(bar.Open*0.9, bar.High*0.9, bar.Low*0.9, bar.Close*0.9)
        if (bar.Close > bar.Open) {
            // long/short/closelong/closeshort
            c.signal("long", bar.High, 1.5)
        } else if (bar.Close < bar.Open) {
            c.signal("closelong", bar.Low, 1.5)
        }
        c.close()
    })
}
def main():
    # 调用KLineChart函数创建图表控制对象c
    c = KLineChart({
        "overlay": True
    })

    # 使用现货交易所对象测试,获取K线数据。如果使用期货交易所对象测试,需要先设置合约
    bars = exchange.GetRecords()
    if not bars:
        return

    for bar in bars:
        c.begin(bar)
        c.barcolor('rgba(255, 0, 0, 0.2)' if bar.Close > bar.Open else 'rgba(0, 0, 0, 0.2)')
        if bar.Close > bar.Open:
            c.bgcolor('rgba(0, 255, 0, 0.5)')

        h = c.plot(bar.High, 'high')
        l = c.plot(bar.Low, 'low')

        c.fill(h, l, 'rgba(255, 0, 0, 0.2)' if bar.Close > bar.Open else 'rgba(255, 0, 0, 0.2)')
        c.hline(bar.High)
        c.plotarrow(bar.Close - bar.Open)
        c.plotshape(bar.Low, style = 'diamond')
        c.plotchar(bar.Close, char = 'X')
        c.plotcandle(bar.Open*0.9, bar.High*0.9, bar.Low*0.9, bar.Close*0.9)
        if bar.Close > bar.Open:
            # long/short/closelong/closeshort
            c.signal("long", bar.High, 1.5)
        elif bar.Close < bar.Open:
            c.signal("closelong", bar.Low, 1.5)

        c.close()
// 暂不支持
如果在策略自定义画图区域画图必须有图表控制对象,使用函数KLineChart创建该对象。KLineChart函数的参数为一个图表配置结构,在参考代码中使用的图表结构很简单{overlay: true})。这个图表配置结构仅仅设置了画图内容在图表主图上输出,如果overlay设置为false则图表上的内容都输出在副图上,如果需要指定某个画图函数在主图上画出也可以在具体函数调用中指定参数overlay为true。
在K线数据上遍历执行画图操作,画图操作中必须以c.begin(bar)函数调用作为起始,以c.close()函数调用作为结束。画图操作中支持的Pine语言的画图接口函数有:
-
barcolor:设置K线颜色
barcolor(color, offset, editable, show_last, title, display)
c.barcolor(bar.Close > bar.Open ? 'rgba(255, 0, 0, 0.2)' : 'rgba(0, 0, 0, 0.2)') // 使用本例中参考代码中的例子说明,不再赘述c.barcolor('rgba(255, 0, 0, 0.2)' if bar.Close > bar.Open else 'rgba(0, 0, 0, 0.2)')display参数可选:“none”, “all”
-
bgcolor:用指定颜色填充K线的背景
bgcolor(color, offset, editable, show_last, title, display, overlay)
c.bgcolor('rgba(0, 255, 0, 0.5)')c.bgcolor('rgba(0, 255, 0, 0.5)')display参数可选:“none”, “all”
-
plot:在图表上绘制一系列数据
plot(series, title, color, linewidth, style, trackprice, histbase, offset, join, editable, show_last, display)
c.plot(bar.High, 'high')h = c.plot(bar.High, 'high')style参数可选:“stepline_diamond”, “stepline”, “cross”, “areabr”, “area”, “circles”, “columns”, “histogram”, “linebr”, “line”display参数可选:“none”, “all”
-
fill:使用提供的颜色填充两个绘图或hline之间的背景
fill(hline1, hline2, color, title, editable, fillgaps, display)
let h = c.plot(bar.High, 'high')
let l = c.plot(bar.Low, 'low')

c.fill(h, l, {color: bar.Close > bar.Open ? 'rgba(255, 0, 0, 0.2)' : 'rgba(255, 0, 0, 0.2)'})
h = c.plot(bar.High, 'high') l = c.plot(bar.Low, 'low') c.fill(h, l, {"color": 'rgba(255, 0, 0, 0.2)' if bar.Close > bar.Open else 'rgba(255, 0, 0, 0.2)'})display参数可选:“none”, “all”
由于
JavaScript语言不能根据函数形参名称指定传入参数,为了解决这个问题可以使用一个{key: value}结构指定传入某个形参名称的参数,例如参考代码中使用{color: bar.Close > bar.Open ? 'rgba(255, 0, 0, 0.2)' : 'rgba(255, 0, 0, 0.2)'}指定fill函数的color参数。如果需要连续指定多个形参名称的参数,可以使用{key1: value1, key2: value2, key3: value3}。例如本例子中增加指定一个title参数:{color: bar.Close > bar.Open ? 'rgba(255, 0, 0, 0.2)' : 'rgba(255, 0, 0, 0.2)', title: 'fill'}。对于颜色值可以使用
'rgba(255, 0, 0, 0.2)'方式设置,也可以使用'#FF0000'方式设置。 -
hline:在给定的固定价格水平上呈现水平线
hline(price, title, color, linestyle, linewidth, editable, display)
c.hline(bar.High)c.hline(bar.High)linestyle参数可选:“dashed”, “dotted”, “solid”display参数可选:“none”, “all”
-
plotarrow:在图表上绘制向上和向下箭头
plotarrow(series, title, colorup, colordown, offset, minheight, maxheight, editable, show_last, display)
c.plotarrow(bar.Close - bar.Open)c.plotarrow(bar.Close - bar.Open)display参数可选:“none”, “all”
-
plotshape:在图表上绘制可视形状
plotshape(series, title, style, location, color, offset, text, textcolor, editable, size, show_last, display)
c.plotshape(bar.Low, {style: 'diamond'})c.plotshape(bar.Low, style = 'diamond')-
style参数可选:“diamond”, “square”, “label_down”, “label_up”, “arrow_down”, “arrow_up”, “circle”, “flag”, “triangle_down”, “triangle_up”, “cross”, “xcross” -
location参数可选:“abovebar”, “belowbar”, “top”, “bottom”, “absolute” -
size参数可选:“10px”, “14px”, “20px”, “40px”, “80px”,对比Pine语言中的size.tiny、size.small、size.normal、size.large、size.hugesize.auto即size.small。 -
display参数可选:“none”, “all”
-
-
plotchar:在图表上使用任何给定的Unicode字符绘制可视形状
plotchar(series, title, char, location, color, offset, text, textcolor, editable, size, show_last, display)
c.plotchar(bar.Close, {char: 'X'})c.plotchar(bar.Close, char = 'X')-
location参数可选:“abovebar”, “belowbar”, “top”, “bottom”, “absolute” -
size参数可选:“10px”, “14px”, “20px”, “40px”, “80px”,对比Pine语言中的size.tiny、size.small、size.normal、size.large、size.hugesize.auto即size.small。 -
display参数可选:“none”, “all”
-
-
plotcandle:在图表上绘制K线图
plotcandle(open, high, low, close, title, color, wickcolor, editable, show_last, bordercolor, display)
c.plotcandle(bar.Open*0.9, bar.High*0.9, bar.Low*0.9, bar.Close*0.9)c.plotcandle(bar.Open*0.9, bar.High*0.9, bar.Low*0.9, bar.Close*0.9)display参数可选:“none”, “all”
-
signal:Pine语言上没有的函数,这里用来画买卖信号
signal(direction, price, qty, id)
c.signal("long", bar.High, 1.5)c.signal("long", bar.High, 1.5)传入的参数
"long"表示交易方向,可选"long"、"closelong"、"short"、"closeshort"。传入的参数bar.High为标记信号的Y轴位置。传入的参数1.5表示信号的交易数量。可以传入第四个参数用来替换默认画出的文本内容,画出的信号标记默认文本为交易方向,例如:"closelong"。
以上函数调用时用到的一些颜色、样式等设置,参看使用KLineChart函数画图的专题文章
LogReset()
LogReset(),该函数用于清除日志。可以传入一个整数数值参数,指定保留最近日志条数,清除其余日志。每次启动的启动日志算一条,所以如果不传入参数并且策略起始时没有日志输出,就会完全不显示日志,等待托管者日志回传(并非异常情况)。该函数无返回值。
function main() {
    // 保留最近10条日志,清除其余日志
    LogReset(10)
}
def main():
    LogReset(10)
void main() {
    LogReset(10);
}
LogVacuum()
LogVacuum(),在调用LogReset()函数清除日志后,回收SQLite删除数据时占用的储存空间。该函数无返回值。
原因是SQLite删除数据时不回收占用的空间,需要执行VACUUM清理表,释放空间。该函数调用时会发生文件移动操作,延迟较大,建议在合适的时间间隔调用。
行情API
主要的行情接口函数:
| 函数名 | 说明 |
|---|---|
| GetTicker | 获取tick行情数据 |
| GetRecords | 获取K线数据 |
| GetDepth | 获取订单薄数据(订单深度数据) |
| GetTrades | 获取市场上最近交易记录 |
以下函数均可通过exchange或exchanges[0]对象调用,例如:exchange.GetTicker()或exchanges[0].GetTicker(),函数返回当前交易对、设置合约的市场行情数据。
带有网络访问的API函数调用的重要提示:
在调用任何访问交易所接口的API函数时(如exchange.GetTicker()、exchange.Buy(Price, Amount)、exchange.CancelOrder(Id)等)都有可能由于各种原因导致访问失败。所以要对这些函数的调用做容错处理,举例:exchange.GetTicker()获取行情数据函数可能由于交易所服务器问题、网络通信问题等原因导致exchange.GetTicker()函数返回的值为null。这时就要对exchange.GetTicker()返回的值做容错处理。
如下代码exchange.GetTicker()函数返回的数据赋值给ticker变量,我们在使用ticker这个变量之前就需要对其容错处理。
function main() {
    var ticker = exchange.GetTicker()
    if(!ticker){
        // 重新调用一次,或者其它处理逻辑
        ticker = exchange.GetTicker()
    }
}
def main():
    ticker = exchange.GetTicker()
    if not ticker:
        ticker = exchange.GetTicker()
void main() {
    auto ticker = exchange.GetTicker();
    if(!ticker.Valid) {
        ticker = exchange.GetTicker();
        Log("测试");
    }
}
另外对于策略的容错性能测试,FMZ专门在回测中增加了独有的容错模式回测。回测系统可以根据设置的参数随机给一些实盘时会发生网络访问的API接口返回一些失败调用时的返回值,可以快速的检测程序在实盘中的健壮性。 在策略编辑页面切换到回测系统页面,点击「开始回测」按钮右侧的倒三角下拉控件,会弹出「容错模式回测」按钮。
exchange.GetTicker()
exchange.GetTicker(),获取当前交易对、合约对应的市场当前行情,返回值:Ticker结构体。
回测系统中exchange.GetTicker()函数返回的Ticker数据,其中High、Low为模拟值,取自当时盘口的卖一、买一。数字货币实盘时为交易所Tick接口定义的一定周期内的最高价、最低价。
function main(){
    var ticker = exchange.GetTicker()
    /*
        可能由于网络原因,访问不到交易所接口(即使托管者程序所在设备能打开交易所网站,但是API接口也可能访问不通)
        此时ticker为null,当访问ticker.High时,会导致错误,所以在测试该代码时,确保可以访问到交易所接口
    */
    Log("High:", ticker.High, "Low:", ticker.Low, "Sell:", ticker.Sell, "Buy:", ticker.Buy, "Last:", ticker.Last, "Volume:", ticker.Volume)
}
def main():
    ticker = exchange.GetTicker()
    Log("High:", ticker["High"], "Low:", ticker["Low"], "Sell:", ticker["Sell"], "Buy:", ticker["Buy"], "Last:", ticker["Last"], "Volume:", ticker["Volume"])
void main() {
    auto ticker = exchange.GetTicker();
    Log("High:", ticker.High, "Low:", ticker.Low, "Sell:", ticker.Sell, "Buy:", ticker.Buy, "Last:", ticker.Last, "Volume:", ticker.Volume);
}
实盘时(非回测)exchange.GetTicker()函数的返回值中Info属性储存接口调用时返回的原始数据。
exchange.GetDepth()
exchange.GetDepth(),获取当前交易对、合约对应的市场的订单薄数据,返回值:Depth结构体。
Depth结构体包含两个结构体数组,分别是Asks[]和Bids[],Asks和Bids包含以下结构体变量:
| 数据类型 | 变量名 | 说明 |
|---|---|---|
| number | Price | 价格 |
| number | Amount | 数量 |
例如我想获取当前卖二价,可以这么写代码:
function main(){
    var depth = exchange.GetDepth()
    /*
        可能由于网络原因,访问不到交易所接口(即使托管者程序所在设备能打开交易所网站,但是API接口也可能访问不通)
        此时depth为null,当访问depth.Asks[1].Price时,会导致错误,所以在测试该代码时,确保可以访问到交易所接口
    */
    var price = depth.Asks[1].Price
    Log("卖二价为:", price)
}
def main():
    depth = exchange.GetDepth()
    price = depth["Asks"][1]["Price"]
    Log("卖二价为:", price)
void main() {
    auto depth = exchange.GetDepth();
    auto price = depth.Asks[1].Price;
    Log("卖二价为:", price);
}
exchange.GetTrades()
exchange.GetTrades(),获取当前交易对、合约对应的市场的交易历史(非自己),返回值:Trade结构体数组。部分交易所不支持该函数,具体返回的数据是多少范围内的成交记录因交易所而定,需要根据具体情况处理。
返回数据是一个数组,其中每个元素的时间顺序和exchange.GetRecords函数的返回数据顺序一致,即数组最后一个元素是距离当前时间最近的数据。
// 在模拟回测中数据为空,必须实盘才有交易历史
function main(){
    var trades = exchange.GetTrades()
    /*
        可能由于网络原因,访问不到交易所接口(即使托管者程序所在设备能打开交易所网站,但是API接口也可能访问不通)
        此时trades为null,当访问trades[0].Id时,会导致错误,所以在测试该代码时,确保可以访问到交易所接口
    */
    Log("id:", trades[0].Id, "time:", trades[0].Time, "Price:", trades[0].Price, "Amount:", trades[0].Amount, "type:", trades[0].Type)
}
def main():
    trades = exchange.GetTrades()
    Log("id:", trades[0]["Id"], "time:", trades[0]["Time"], "Price:", trades[0]["Price"], "Amount:", trades[0]["Amount"], "type:", trades[0]["Type"])
void main() {
    auto trades = exchange.GetTrades();
    Log("id:", trades[0].Id, "time:", trades[0].Time, "Price:", trades[0].Price, "Amount:", trades[0].Amount, "type:", trades[0].Type);
}
exchange.GetRecords()
exchange.GetRecords(Period),返回K线数据。K线周期在创建实盘时指定,如果在调用exchange.GetRecords()函数时指定了参数,获取的就是该参数周期对应的K线数据。如果函数调用时没有指定参数,按照实盘参数上设置的K线周期或者回测页面设置的K线周期返回对应的K线数据。
参数Period:
- PERIOD_M1:指1分钟
- PERIOD_M5:指5分钟
- PERIOD_M15:指15分钟
- PERIOD_M30:指30分钟
- PERIOD_H1:指1小时
- PERIOD_D1:指一天
参数
Period的值除了可以传以上定义的标准周期,还可以传入数值,单位为秒。
exchange.GetRecords(Period)函数的返回值:
返回值为Record结构体数组,返回的K线数据会随时间累积,累积K线柱数量的上限受到exchange.SetMaxBarLen函数设置的影响,没有设置过时默认上限为5000个K线柱。当K线数据到达K线柱累积上限,之后会更新加入一根K线柱的同时删除一根最早时间的K线柱(如队列进出)。部分交易所没有提供K线接口,则托管者实时收集市场成交记录数据生成K线。
初始调用GetRecords函数时获取的K线柱数量:
- 回测系统中会预先取回测周期起始时刻前1000根K线柱,作为初始K线数据。
- 实盘时具体获取的K线柱数量基于交易所K线接口可获取的最大数据量而定。
对于exchange.GetRecords(Period)函数,数字货币的实盘、回测均支持自定义周期。参数Period为秒数,例如:
function main() {
    // 打印K线周期为120秒(2分钟)的K线数据
    Log(exchange.GetRecords(60 * 2))
    // 打印K线周期为5分钟的K线数据
    Log(exchange.GetRecords(PERIOD_M5))
}
def main():
    Log(exchange.GetRecords(60 * 2))
    Log(exchange.GetRecords(PERIOD_M5))
void main() {
    Log(exchange.GetRecords(60 * 2)[0]);
    Log(exchange.GetRecords(PERIOD_M5)[0]);
}
Period参数设置为5,即为请求获取5秒为周期的K线数据。
如果Period参数不能被60整除(即代表的周期是不可用分钟为单位的周期),系统底层则使用GetTrades的相关接口获取成交记录数据,合成所需的K线数据。
如果Period参数能被60整除,则最小使用1分钟K线数据(尽可能使用较大的周期合成所需K线数据),合成所需的K线数据。
function main(){
    var records = exchange.GetRecords(PERIOD_H1)
    /*
        可能由于网络原因,访问不到交易所接口(即使托管者程序所在设备能打开交易所网站,但是API接口也可能访问不通)
        此时records为null,当访问records[0].Time时,会导致错误,所以在测试该代码时,确保可以访问到交易所接口
    */
    Log("第一根k线数据为,Time:", records[0].Time, "Open:", records[0].Open, "High:", records[0].High)
    Log("第二根k线数据为,Time:", records[1].Time ,"Close:", records[1].Close)
    Log("当前K线(最新)", records[records.length-1], "上一根K线", records[records.length-2])
}
def main():
    records = exchange.GetRecords(PERIOD_H1)
    Log("第一根k线数据为,Time:", records[0]["Time"], "Open:", records[0]["Open"], "High:", records[0]["High"])
    Log("第二根k线数据为,Time:", records[1]["Time"], "Close:", records[1]["Close"])
    Log("当前K线(最新)", records[-1], "上一根K线", records[-2])
void main() {
    auto records = exchange.GetRecords(PERIOD_H1);
    Log("第一根k线数据为,Time:", records[0].Time, "Open:", records[0].Open, "High:", records[0].High);
    Log("第二根k线数据为,Time:", records[1].Time, "Close:", records[1].Close);
    Log("当前K线(最新)", records[records.size() - 1], "上一根K线", records[records.size() - 2]);
}
exchange.GetRecords()函数获取K线数据有2种情况
-
交易所提供了K线数据接口,这种情况获取的数据是交易所直接返回的数据。
-
交易所没有提供K线数据接口,FMZ的托管者程序在每次策略程序调用
exchange.GetRecords()时获取交易所最近的成交记录。即调用exchange.GetTrades()函数获取数据从而合成K线数据。
回测系统中模拟级别回测由于需要设置底层K线周期(回测系统模拟级别回测时,根据设置的底层K线周期使用对应的K线数据生成tick数据),需要注意在策略中获取的K线数据的周期不能小于底层K线周期。因为在模拟级别回测中,各个周期的K线数据在回测系统中都是通过底层K线周期对应的K线数据合成的。
C++语言中如果需要自己构造K线数据有以下代码范例:
#include <sstream>
void main() {
    Records r;
    r.Valid = true;
    for (auto i = 0; i < 10; i++) {
        Record ele;
        ele.Time = i * 100000;
        ele.High = i * 10000;
        ele.Low = i * 1000;
        ele.Close = i * 100;
        ele.Open = i * 10;
        ele.Volume = i * 1;
        r.push_back(ele);
    }
    // 输出显示:Records[10]
    Log(r);
    auto ma = TA.MA(r,10);
    // 输出显示:[nan,nan,nan,nan,nan,nan,nan,nan,nan,450]
    Log(ma);
}
exchange.GetPeriod()
exchange.GetPeriod()函数返回回测、实盘运行策略时在发明者量化交易平台网站页面上设置的K线周期。返回值为整数,单位为秒。返回值:数值类型。
function main() {
    // 例如回测、实盘时发明者量化交易平台网站页面上设置的K线周期为1小时
    var period = exchange.GetPeriod()
    Log("K线周期:", period / (60 * 60), "小时")
}
def main():
    period = exchange.GetPeriod()
    Log("K线周期:", period / (60 * 60), "小时")
void main() {
    auto period = exchange.GetPeriod();
    Log("K线周期:", period / (60 * 60.0), "小时");
}
exchange.SetMaxBarLen(Len)
exchange.SetMaxBarLen(Len)函数对于数字货币策略运行时影响两个方面。
- 影响第一次调用时获取K线的线柱(BAR)数量。
- 影响K线线柱(BAR)上限数量。
function main() {
    exchange.SetMaxBarLen(50)
    var records = exchange.GetRecords()
    Log(records.length, records)
}
def main():
    exchange.SetMaxBarLen(50)
    r = exchange.GetRecords()
    Log(len(r), r)
void main() {
    exchange.SetMaxBarLen(50);
    auto r = exchange.GetRecords();
    Log(r.size(), r[0]);
}
exchange.GetRawJSON()
exchange.GetRawJSON(),返回最后一次rest请求返回的原始内容(字符串),可以用来自行解析数据。返回值:字符串类型,只在数字货币策略实盘环境下有效,回测不支持该函数。
C++语言策略不支持该函数。
function main(){
    exchange.GetAccount();
    var obj = JSON.parse(exchange.GetRawJSON());
    Log(obj);
}
import json
def main():
    exchange.GetAccount()
    obj = json.loads(exchange.GetRawJSON())
    Log(obj)
void main() {
    auto obj = exchange.GetAccount();
    // C++ 不支持GetRawJSON函数
    Log(obj);
}
exchange.GetRate()
exchange.GetRate(),返回交易所使用的流通货币与当前显示的计价货币的汇率,返回1表示禁用汇率转换。返回值:数值类型。
注意:
- 如果没有调用
exchange.SetRate()设置过转换汇率,exchange.GetRate()默认返回的汇率值是1,即当前显示的计价货币没有发生过汇率转换。 - 如果使用
exchange.SetRate()设置过一个汇率值,例如exchange.SetRate(7),那么当前exchange这个交易所对象代表的交易所流通货币的行情、深度、下单价格等等所有价格信息,都会被乘以之前设置的汇率7进行转换。 - 如果
exchange对应的是以美元为计价货币的交易所,调用exchange.SetRate(7)后,实盘所有价格都会被乘7转换成接近CNY的价格。此时使用exchange.GetRate()获取的汇率值就是7。
exchange.GetUSDCNY()
exchange.GetUSDCNY(),返回美元最新汇率(yahoo提供的数据源)。返回值:数值类型。
exchange.SetData(Key, Value)
exchange.SetData(Key, Value)函数用于设置策略运行时加载的数据,可以是任何经济指标、行业数据、相关指数等。用于策略量化考核所有可量化的信息,支持回测系统中使用。
exchange.SetData(Key, Value)函数的调用方式:
-
在策略中直接写入数据 要求数据格式如同以下例子中的
data变量。/*backtest start: 2020-01-21 00:00:00 end: 2020-02-12 00:00:00 period: 1d basePeriod: 1d exchanges: [{"eid":"Bitfinex","currency":"BTC_USD"}] */ function main() { var data = [ [1579536000000, "abc"], [1579622400000, 123], [1579708800000, {"price": 123}], [1579795200000, ["abc", 123, {"price": 123}]] ] exchange.SetData("test", data) while(true) { Log(exchange.GetData("test")) Sleep(1000) } }'''backtest start: 2020-01-21 00:00:00 end: 2020-02-12 00:00:00 period: 1d basePeriod: 1d exchanges: [{"eid":"Bitfinex","currency":"BTC_USD"}] ''' def main(): data = [ [1579536000000, "abc"], [1579622400000, 123], [1579708800000, {"price": 123}], [1579795200000, ["abc", 123, {"price": 123}]] ] exchange.SetData("test", data) while True: Log(exchange.GetData("test")) Sleep(1000)/*backtest start: 2020-01-21 00:00:00 end: 2020-02-12 00:00:00 period: 1d basePeriod: 1d exchanges: [{"eid":"Bitfinex","currency":"BTC_USD"}] */ void main() { json data = R"([ [1579536000000, "abc"], [1579622400000, 123], [1579708800000, {"price": 123}], [1579795200000, ["abc", 123, {"price": 123}]] ])"_json; exchange.SetData("test", data); while(true) { Log(exchange.GetData("test")); Sleep(1000); } }以上测试代码运行时,会在对应的时间获取对应的数据,如图:
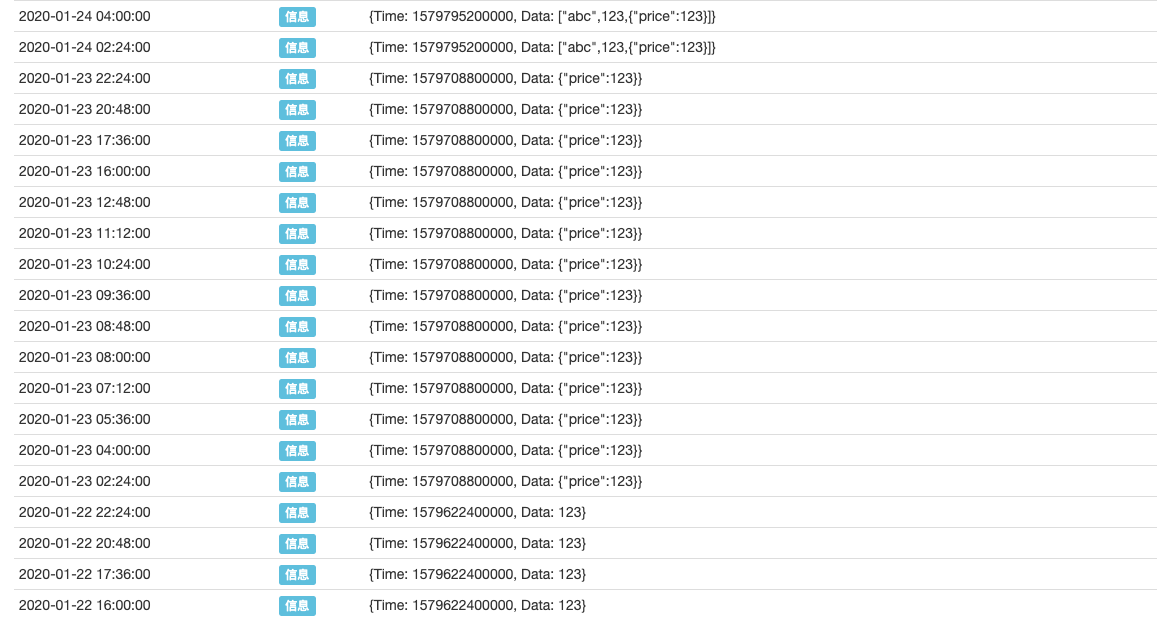
可以看到时间戳
1579622400000对应的时间为2020-01-22 00:00:00,当策略程序运行在这个时间之后,在下一条数据时间戳1579708800000即时间2020-01-23 00:00:00之前,调用exchange.GetData(Source)函数获取数据。获取的都是[1579622400000, 123]该条数据的内容,随着程序继续运行,时间变化,以此类推获取逐条数据。 -
通过外部链接请求数据
请求到的数据格式
{
    "schema":["time","data"],
    "data":[
        [1579536000000, "abc"],
        [1579622400000, 123],
        [1579708800000, {"price": 123}],
        [1579795200000, ["abc", 123, {"price": 123}]]
    ]
}
其中
schema为加载数据的主体中的每一条记录的数据格式,该格式固定为["time","data"]对应data属性中的逐条数据的格式。data属性中储存的为数据主体,每条数据由毫秒级别时间戳和数据内容构成(数据内容可以是任何可JSON编码的数据)。测试用的服务程序,使用
Go语言编写:package main import ( "fmt" "net/http" "encoding/json" ) func Handle (w http.ResponseWriter, r *http.Request) { defer func() { fmt.Println("req:", *r) ret := map[string]interface{}{ "schema": []string{"time","data"}, "data": []interface{}{ []interface{}{1579536000000, "abc"}, []interface{}{1579622400000, 123}, []interface{}{1579708800000, map[string]interface{}{"price":123}}, []interface{}{1579795200000, []interface{}{"abc", 123, map[string]interface{}{"price":123}}}, }, } b, _ := json.Marshal(ret) w.Write(b) }() } func main () { fmt.Println("listen http://localhost:9090") http.HandleFunc("/data", Handle) http.ListenAndServe(":9090", nil) }程序在接收到请求后的应答数据:
{
    "schema":["time","data"],
    "data":[
        [1579536000000, "abc"],
        [1579622400000, 123],
        [1579708800000, {"price": 123}],
        [1579795200000, ["abc", 123, {"price": 123}]]
    ]
}
测试策略代码:
/*backtest
start: 2020-01-21 00:00:00
end: 2020-02-12 00:00:00
period: 1d
basePeriod: 1d
exchanges: [{"eid":"Bitfinex","currency":"BTC_USD"}]
*/
function main() {
    while(true) {
        Log(exchange.GetData("http://xxx.xx.x.xx:9090/data"))
        Sleep(1000)
    }
}
'''backtest start: 2020-01-21 00:00:00 end: 2020-02-12 00:00:00 period: 1d basePeriod: 1d exchanges: [{"eid":"Bitfinex","currency":"BTC_USD"}] ''' def main(): while True: Log(exchange.GetData("http://xxx.xx.x.xx:9090/data")) Sleep(1000)/*backtest start: 2020-01-21 00:00:00 end: 2020-02-12 00:00:00 period: 1d basePeriod: 1d exchanges: [{"eid":"Bitfinex","currency":"BTC_USD"}] */ void main() { while(true) { Log(exchange.GetData("http://xxx.xx.x.xx:9090/data")); Sleep(1000); } }
exchange.GetData(Source)
exchange.GetData(Source)函数用于获取exchange.SetData(Key, Value)函数加载的数据或外部链接提供的数据,支持回测系统中使用。回测时一次性获取数据,实盘时缓存一分钟的数据。
- 获取直接写入的数据的调用方式
/*backtest
start: 2020-01-21 00:00:00
end: 2020-02-12 00:00:00
period: 1d
basePeriod: 1d
exchanges: [{"eid":"Bitfinex","currency
- 有跑海龟的吗 用小时线好 还是日线好?
- p网认证无法提交照片的问题
- 量化投资模型:一招让你轻松辨别上市公司财报是否造假!干货!
- ..............
- 请教chart问题,双纵坐标走势图
- 大家怎么处理暴涨暴跌下的api失联问题呢
- __init_botvs__运行出错求版主看下
- bigone是否兼容?
- 币安的取现要怎么实现??
- 为什么okex获取深度要报异常呢GetDepth: Invalid depth:
- 参数最佳化的三大陷阱——前视偏差、过度优化、曲线拟合
- 提个建议
- 请技术支持帮忙看看这个错误,难道不支持OKEX的交易对 LTC_USDT吗?
- bitfinex的margin trade 支持吗? 就是带杠杆的。
- SyntaxError: error parsing token (line 1311) 机器突然不能用了,前两天还能用呢,改动了啥呀?
- Bitcoin trading by using bots
- 高波动背后的根本逻辑和交易策略
- 交易日志保存
- OKEX期货 10月30号之前无法回测?
- zb的BTC_USDT 溢价这么多,为什么没人搬呢。
qq89520 有一个问题_C函数是一直重试还是只重试一次
haiwwhai _C(function, args...) 这个默认是3s吗? 修改默认直接放_CDelay(1000) 在_C(function, args...) 之前就可以了吗?设定一次就可以了吧?
lanchaiye 集群: 如果你创建1000个机器人并发,也是没有压力的, 可以创建多个托管者来分散任务 有代码例子来建集群?如何建多个托管者来分散任务
wangyj1 Log(talib.help('MACD'));只能在js下使用,python下没有talib.help属性...
cjz140 _C(function, args…) 和Sleep 函数有什么区别呢,我觉得都是等待重试的意思
3263243y SetErrorFilter 后怎么清空 ErrorFilter?不过滤错误信息。
qq47898077 如果想用第三方库有什么办法吗?
qq47898077 如果想继承交易所对象定义新的类的话,父类应该填什么呢。
ethanwu 有本地调试工具吗?
pengliheng 那exange.IO("status")呢?
pengliheng 为什么sell的函数是灰色的,是不是代表函数不可用了?by是可用的,那要如何卖呢
pengliheng 为什么sell的函数是灰色的,是不是代表函数不可用了?by是可用的,那要如何卖呢
pengliheng js没白学,哈哈哈,就想问问es6支持么
pengliheng js没白学,哈哈哈,就想问问es6支持么
Don. Volume的均线要怎么写出来?
zjuturtle 按市价购买exchange.Buy(1000)如果不成功会返回什么?
宁公子 这个新字体好看~
hippo Bitmex的测试网络(testnet.bitmex.com)同样存在API接口,但目前交易所只能选Bitmex主站,API文档地址是 https://testnet.bitmex.com/app/apiOverview 请问如何支持?
cxjijin var ret1 = exchanges[0].IO("api", "future_estimated_price", "symbol=btc_usd"); Log('ok期货预估交割价格', ret1); https://dn-filebox.qbox.me/d1ed268c1e75753c5d289447d279aa9d81e41b5f.png 调用其他交易所功能接口,这么写报错,是为什么呢?
allenfrostline 想问realTicker和Ticker有什么区别?最近在重写套利的策略,同时出现了这两个但前者API里似乎没有提到
visions 你好 作为一个python开发者 觉得你们的api文档写的是什么东西?一些字段函数接口看得莫名其妙的,能不能像githubpage和readdocs这样写一份文档?
allenfrostline GetAccount: [EAPI:Rate limit exceeded] 想问这个怎么解决?另外我没有qq有没有微信群之类的?感谢
zhjx2314 不支持StochRSI,是否可以尽快添加
yhfgg python策略实盘的时候脚本是在自己的阿里云服务器还是botvs集群?
yhfgg python用的什么版本?
fkysly GetFee 的 解释应该是”返回一个Fee结构”吧,少了一个构字。
zkwap 使用js能调用talib的方法吗
yhfgg 求python文档
wmjbs123 策略编辑的代码背景能不能搞个黑色的?白色的刺眼,晚上写代码,容易近视
Don. 机器人微信推送中的概要 该怎么设置??
数·狂 订单(Order)结构里能不能加一个成交均价的字段?
小丁丁 GetOrders:获取所有未完成的订单, 返回一个Order数组结构, 在中国比特币交易ETH ,只返回最近的10条 ,这里有返回中国比特币ETH所有未完成的订单的函数吗,表示其它平台都可以用GetOrders返回所有的 ,只有这个鬼中国比特币返回10条,
yhfgg 需要用到统计概率论的数学函数,从哪里用呢?
jiebang $.Cross(x, y)这个函数的返回值是啥意思?
我的昵称 这个 LogReset 清空所有日志, 可以带一个数字参数, 指定保留的条数 这个要怎么删除最新的几条日志?
edwardgyw talib 中CORRE函数好像没有移植过来 是漏掉了么?
穷山僻壤 貌似没有指标引用的功能!有吗
小小 读取的k线时间怎么翻译成现在时间啊,看不懂,太长的一个,解决了,谢谢
小小 数组中的数删除怎么写,我用records.remove(records[0])好像不行啊
snakeayu 平常获取的是小时K线,如何调用日K线的ATR?
snakeayu 平常获取的是小时K线,如何调用日K线的ATR?
57278863 学习一下传统期货怎么获得价格和下单,不好意思,根基很薄
kirin 同求传统期货交易例子!
小小 zero,能写个关于传统期货交易的例子吗
小小 多空单子同时持有的时候,如何打印持仓状态,我的怎么打印的是[object object][object object],怎么获得多单和空单持仓状况啊,还有GetTicker(),当周,次周,和季度怎么都得到当周 价格,括号中的当周,次周和季度我都写了。
cxjijin 期货交易所可以用GetTicker()获取行情吗?, 返回的是那种类型的合约行情(当周、次周..)?
卖大 StochRSI 这个什么指标,能添加吗?
momox CancelOrder(orderId) 根据订单号取消一个订单, 返回true或者false ,请问 true=单子被成功取消,对吧?
momox _G(K, V) 可保存的全局字典表 这个方法保存的全局变量,可以用于不同策略之间的数据共享吗?
flufy3d 冲冲人气
Zero 可以用LogProfitReset重置下收益日志. 之前的收益图表上的历史就没有了.
xcy 能不能直接复制EA过来用
sjironman 感觉这个平台棒棒哒,多在群里交流哈
小小 这是什么语言,有学习资料吗
jxhbtc Data error 一个星期 一直连接不了机器人 怎么解决
dyhhu 指标库TA,只是对收盘价进行计算吗?
btcrobot hi, world
小小梦 _C 函数会无脑重试,直到成功获取结果。
小小梦 python 的 talib 库 需要 安装一下。https://www.botvs.com/bbs-topic/669 可以参看 这个 帖子。
小小梦 Sleep 是 程序什么也不做,等待 参数设定的 毫秒数, _C 是重新调用一次 参数 传入的 函数。
小小梦 不用继承, JS 直接 封装在对象就行了 {name : "新对象", old_exchange : exchange[0], ...... }
小小梦 有本地 编辑器 远程同步插件,基本算是 本地编辑 远程调试。
小小梦 可以来 QQ群,^^ 方便讨论~
小小梦 API文档上 灰色的意思是 这个 函数 没有过多的展开解释,就显示灰色,蓝色的代表 有更多的解释,仅此而已。
小小梦 ES6暂时不支持, ^^
小小梦 可以 到群里QQ 我,问题描述一下,我来解答 ^^
小小梦 直接会返回 一个错误 ,并且 不会下单(其实就是 要买,钱不够!)。
zjuturtle 比如OKCoin,如果购买的量超过了持有的人民币,会返回什么?
小小梦 具体是 哪个交易所呢,我在OK期货会返回一个订单号。
Zero 已经支持运行时切换交易对, 需下载最新托管者. 支持Bter/Poloniex 详情 API文档 交易函数栏下面的描述(清空浏览器缓存后刷新如果看不到)
小小梦 QQ我吧,我帮您找下问题。359706687
职业养鸡户 需要设置白名单, 我设置的是托管机子的IP?
小小梦 这个是 底层链接 没有建立 服务器没响应。API KEY 申请的时候 有要设置 IP地址么?
职业养鸡户 这就尴尬了···我ok可以跑的策略换到比特时代就失灵了,GetAccount 都获取不到 GetAccount: Post http://api.btc38.com/v1/getMyBalance.php: read tcp 192.168.0.227:58596->211.149.148.144:80: wsarecv: A connection attempt failed because the connected party did not properly respond after a period of time, or established connection failed because connected host has failed to respond. 2017-05-23 21:08:24 比特时代 错误 GetAccount: timeout 2017-05-23 21:08:02 比特时代 错误 GetAccount: timeout 2017-05-23 21:07:40 比特时代 错误 GetAccount: timeout 2017-05-23 21:07:20 重启 是不是 IP白名单的问题???
小小梦 交易所的 服务器 没有响应了,TCP协议 三次握手都没有建立。
职业养鸡户 不知道为什么策略用到比特时代的话会一直报这个错 A connection attempt failed because the connected party did not properly respond after a period of time,
小小梦 您好! 说的是 exchange.IO(“api”, ApiName, Args) 这个函数 不支持, 参见 https://www.botvs.com/bbs-topic/812
职业养鸡户 A connection attempt failed because the connected party did not properly respond after a period of time,
职业养鸡户 比特时代不支持吗
小小梦 https://dn-filebox.qbox.me/a709b30c6cc0a3565234b9e0c99b073f7ba8b454.png 应该是可以的。
宁公子 比如我想做个poloniex 的全币种交易,但是BOTvs 支持的币种只有几个,exchange.IO貌似是不支持P网的。
小小梦 可以调用 exchange.IO 这个。
宁公子 需要验证账户的 API 的呢?
小小梦 如果不需要验证账户的 API 可以使用 httpQuery (详见 BotVS 文档), 实际交易 API 需要接入。
小小梦 可以使用 HttpQuery 这个 API 参数传:https://www.okcoin.com/api/v1/future_estimated_price.do?symbol=btc_usd ,这样就可以了。 对于 不用验证 账户的 行情类的 交易所 API 直接就用 平台上的 HttpQuery 这个函数, 那些 跟账户相关的 才用 IO 这个API (IO 不支持这些 不需要验证的行情API )。 帖子 : https://www.botvs.com/bbs-topic/850
visions 好的谢谢,期望能有完善优美的API文档。
小小梦 请问 realTicker 这个API 是在什么地方看到的?
小小梦 https://dn-filebox.qbox.me/fe1a6f5563ed43a5357f858ecf8a50239619228e.png API文档 是JavaScript 语言 描述的,python 版描述的在 “交流社区” 页面置顶的帖子。(如有具体问题欢迎留言提出)
Zero 你好, 多谢建议, 目前API文档正在重构中.
小小梦 您好~显示的是 访问频率超出限制。 https://dn-filebox.qbox.me/a09498920d04cac62624b7438a058d2098d8fb00.png 策略中使用Sleep(1000) 函数了么 ? , 这个1000就是 让程序每轮暂停一秒,可以自行设置,目的就是控制程序 访问API 的频率,因为有些交易所设置了最大访问限制,一定时间超过一定访问次数会拒绝访问,封掉IP地址。
小小梦 https://dn-filebox.qbox.me/c29ab7fc279e1b758355f137907cf52dc8257df6.png 我个人写的 已经对比过OK 的STOCHRSI指标 ,一致 ,就是速度有些慢有待优化,暂时可用。https://www.botvs.com/bbs-topic/392
Zero 可以自己选择是在botvs提供的服务器上回测还是自己的托管者所在服务器回测, 版本是2.7.5
小小梦 现已添加。
小小梦 现在已经可以自己配置 背景风格了。
小小梦 python 文档正在写。
小小梦 可以的 talib 库支持。
hzzgood48 https://www.botvs.com/bbs-topic/276
小小梦 貌似在策略广场有例子,https://www.botvs.com/strategy/15098
Zero 访问Order的AvgPrice属性, 交易所支持可以, 不支持的交易所会一直为0这个属性
yhfgg 第三方库怎么引用?
Zero mathjs看能满足不能, 不能就只能找第三方库复制进策略了. 为了编译速度, 系统只内置了一些少量的库.
小小梦 不客气,有问题在群里可以M我~我基本都在线。
jiebang 谢谢
小小梦 在群里么?你可以看看注释版的 数字货币交易类库代码分析 里面就有 $.Cross函数的注释
Zero 不能删除最新的,只能保留最新的几条..删除之前所有老的.
kirin 要用position[i]获取每个持仓,position是个数组
宁公子 exchange.GetRecords(PERIOD_D1);
kirin 我的传统期货老是报“GetAccount: not login",密码没有输错,就是登陆不了
Zero 默认是周, 要获取指定的需要SetContractType先.
Zero 刚看到,这个true是交易所返回的取消订单这个动作的返回值, 但真正取消没取消,得看交易所内部怎么处理了.
momox 3q
Zero 暂时不能, 是隔离的.
xuanxuan 当然不能,那是MT4的专用吧
Zero Javascript 资料网上到处都有哈
卖大 你的问题解决了吗?
Zero 大部分是, 传入的数据可以直接是records或者是一个纯价格的数组