
What You Need to Know to Familiar with MyLanguage on FMZ -- Interface Charts
In the previous article, we have learned about the template parameters of the "MyLanguage Trading Class Library" of MyLanguage. This template comes with the creation of MyLanguage strategy and encapsulates some functions that need to be set in the trading. In this article, we will continue to learn about the use of MyLanguage on the FMZ Quant Trading Platform.
MyLanguage strategy parameters
The strategy parameters for the MyLanguage are set on the strategy editing page, just like other languages on the FMZ Quant Trading Platform, for example, we take the Dual Thrust strategy of MyLanguage version as an example.
Strategy address: https://www.fmz.com/strategy/128884 。
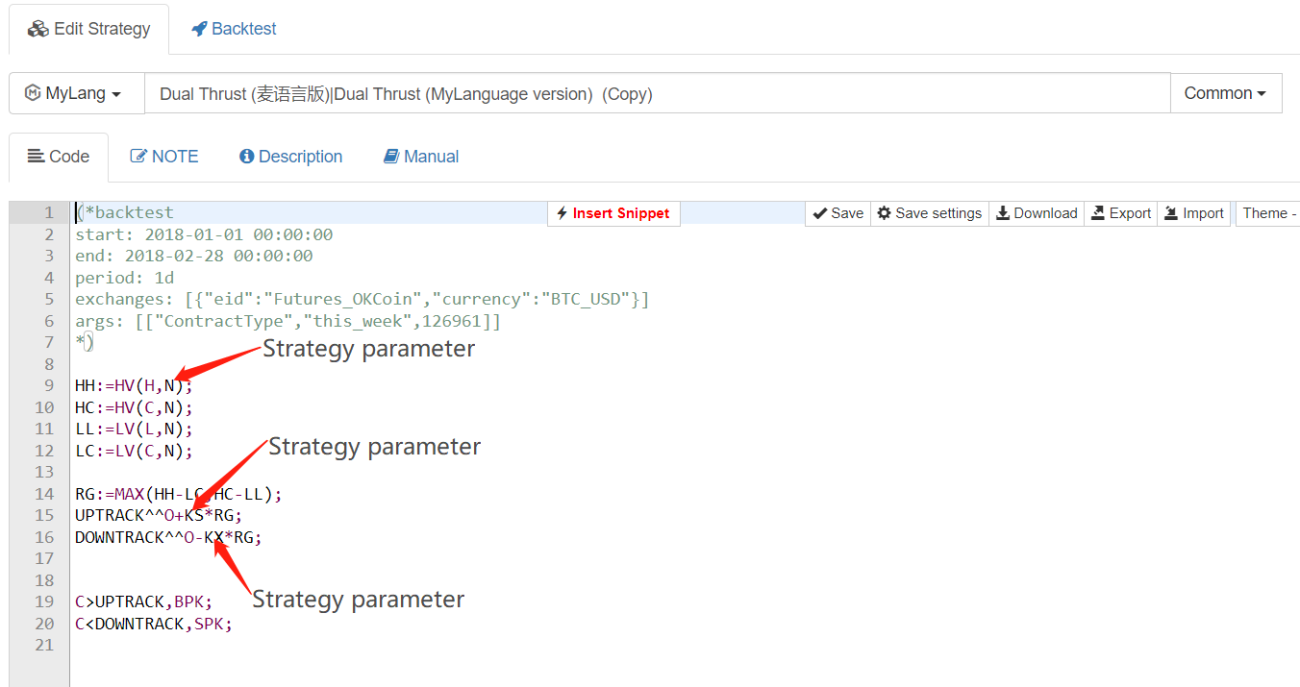
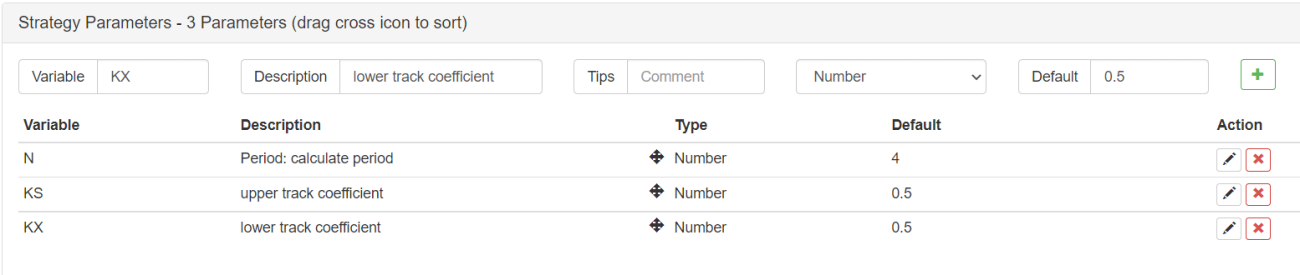
The parameters set to the strategy in the strategy editing page are available directly in the strategy code. Generally, the strategy parameters in MyLanguage adopt numeric types only, other types, such as boolean, drop-down boxes, strings, etc. are not commonly used.
For example, in the above example, the default value of N is 4. If this parameter is not modified when creating a robot, then after the robot running, the value of N in the strategy is 4.
Real bot and backtesting
We have already understood the contents of the MyLanguage strategy level (MyLanguage strategy parameters, template parameters of MyLanguage trading class library). Next, let's take a look at the real bot and backtesting of MyLanguage.
Backtesting
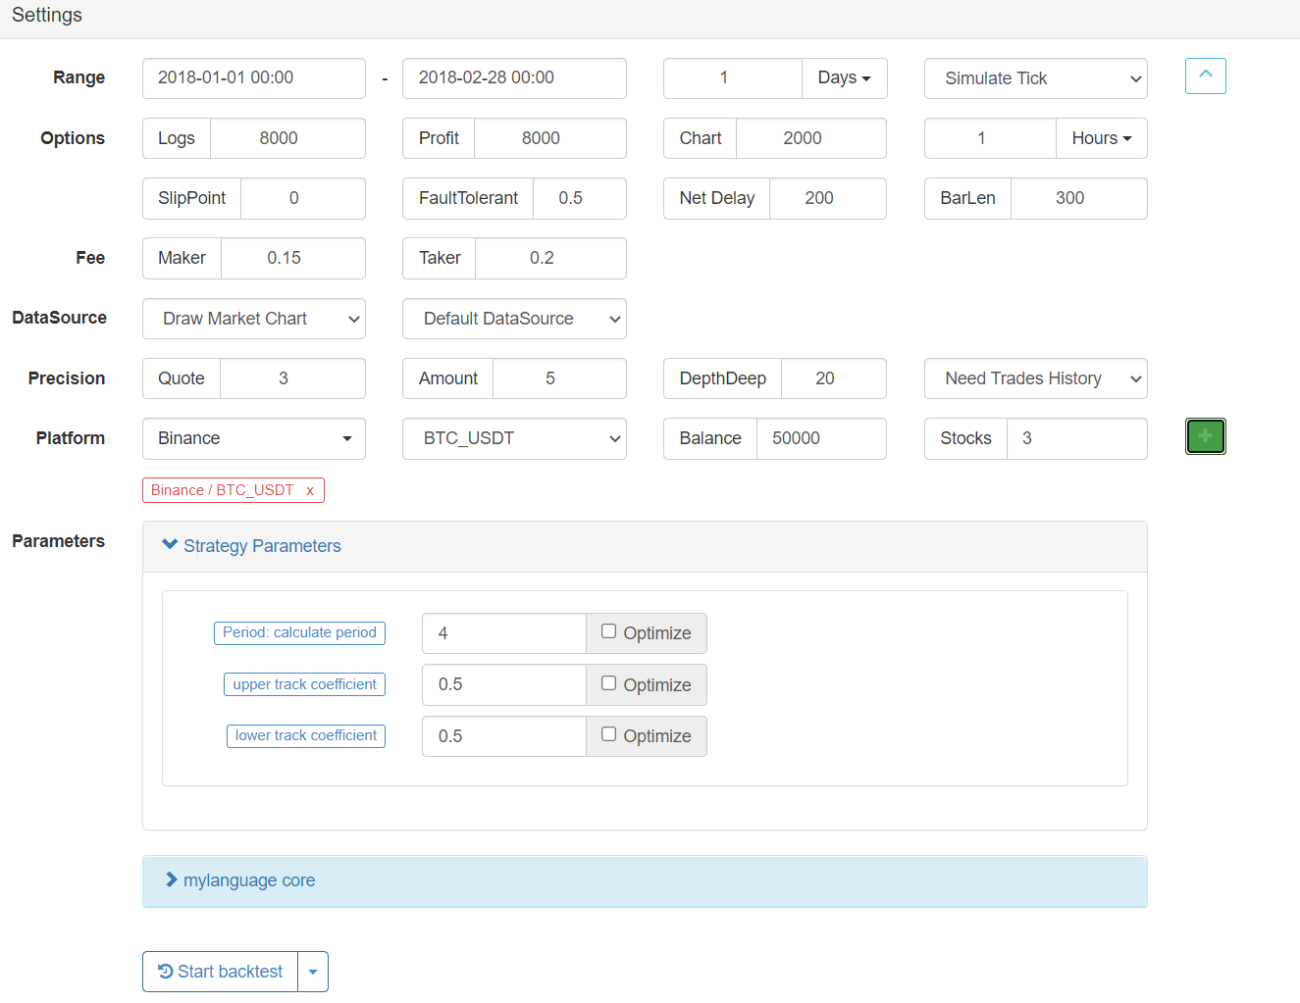
After the backtest time range is selected (start time and end time), set the K-line period of the strategy. Mylanguage also supports multiple K-line period data in the strategy. But the K-line period set here is the default K-line period, and the K-line set here is the daily K-line, so the chart generated automatically after the strategy running is the daily K-line. The backtesting mode is divided into "real-bot level" and "simulation level", which can be found in the document: https://www.fmz.com/bbs-topic/9126. Then we select the market or exchange to be backtested. After adding it, we can backtest. If we need to adjust other parameters, such as the initial backtest fund value, we can set them according to our needs. The mouse will prompt you when you place the mouse over the parameters.
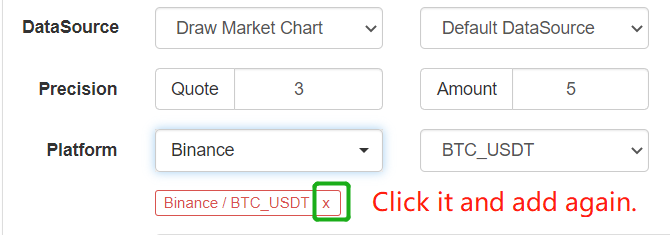
The parameters related to the market and exchange, such as the backtesting simulation fund value, the backtesting trading rate, the backtesting price precision, the trading quantity precision, and the backtesting data source, all of these do not take effect after being modified on the backtesting page. The previously added markets and exchanges need to be deleted, and then we readd them, which are the new.
Real bot
The real bot settings are much simpler. We only need to specify the docker for the created robot configuration (that is, which docker to run the robot on). Set the K-line period and the exchange object to be operated (i.e. the configured exchange account object).
Operation interface
When the strategy is running, there is little difference between the real bot and backtesting, but the backtest has more statistical data automatically generated by the backtesting system.
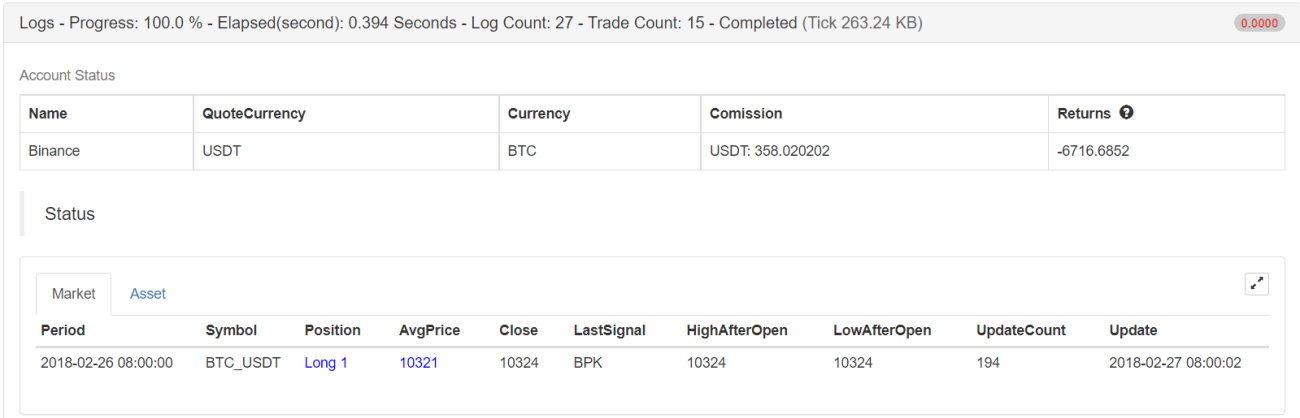
Status bar information
The status bar information is mainly divided into "market information" and "fund information".
The market information mainly records the period start time, transaction type (contract code), position quantity, position price and other data of the default K-line period currently set. It should be noted that the market updates here are different when setting the "Tick model" and "Bar model" in the template parameters of the MyLanguage trading class library. By focusing on the time update here, you can judge the operation of the strategy and the market update. (Preliminary judgment of program jamming, logs stuffing hard disk space and other problems.)
The fund information mainly records the value of the robot from the beginning of operation to the current fund.
Any data in the strategy can also be displayed at the bottom of the status bar, for example, in the example: UPTRACK, DOWNTRACK, which is displayed according to the requirements. Here we need to talk about the assignment method in the strategy code.
The following symbols are used to assign a value to a variable (excerpted from the MyLanguage API document)
Symbol :
The colon represents the assignment and it is output to the chart (sub-chart) and displayed in the status bar table.
Symbol :=
The colon represents the assignment, but it is not output to the chart (main chart, sub-chart...), nor displayed in the status bar table.
Symbol ^^
The two ^ symbols represent assignment, assign values to variables and output them to the chart (main chart), which is displayed in the status bar table.
Symbol ..
The two. symbols represent assignment, assign values to variables and display in the status bar table, but they are not output to the chart (main chart, sub-chart...).
It can be seen that these symbols are all assignment operations, but the difference lies in whether the variables are displayed in the status bar, and whether the variables are drawn on the main chart and the sub-chart (to be shown later).
^^, :, .. all can display variable values at the bottom of the status bar table.
K-Line Chart
According to the default K-line period set on the strategy backtesting and real bot pages, the strategy will generate a K-line chart, and display the variable value curve on the K-line chart according to the content of the strategy. For example, the chart in the example:
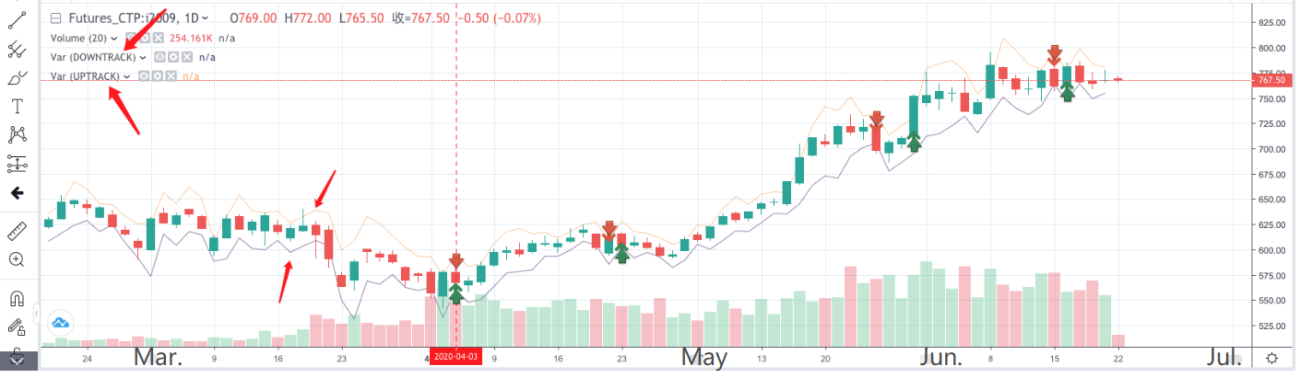
Main chart:
Simply put, the main chart shares the same Y-axis as the K-line, so when do you need to display the data in the main chart?
When the value of the data and indicator line to be displayed is similar to the price of the subject matter (that is, it is similar to the price value on the K-line BAR), it can be displayed on the main chart, such as the average line calculated by the strategy, such as the uptrack and downtrack (UPTRACK and DOWNTRACK) of the price calculated in this example.
Sub-chart:
What kind of data is suitable for displaying on the sub-chart?
When the difference between the line to be drawn (displayed data) and the price value on the BAR of the K-line is large (much larger or smaller than the price on the K-line), it can be displayed on the sub-chart, because if it is displayed on the main chart at this time, it will result in image compression, which is very inconvenient to observe. For example, when MACD indicators are calculated and displayed on the chart.
For example, add a sentence to the example strategy, AA ^ ^ (O-C) * 100000;
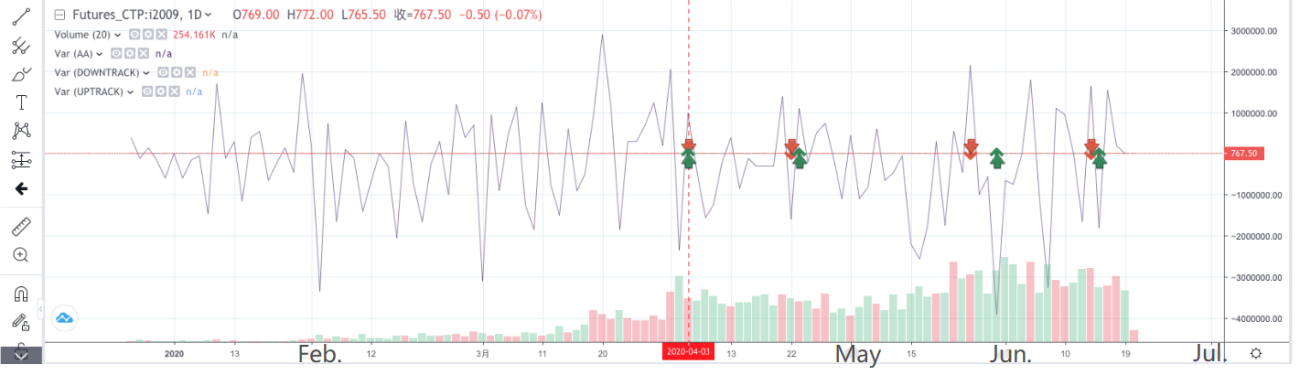
The K-line chart was compressed and cannot be found.
Another difference is that the MyLanguage strategy charts are HighCharts for real bot and tradingView charts for backtesting.
Chart for real bot:
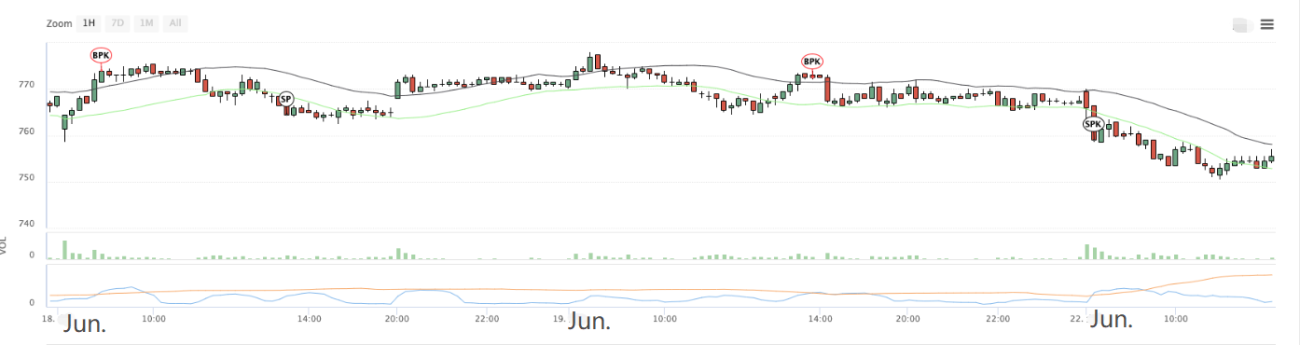
Logs displayed
MyLanguage strategies, when the trading signal is triggered (BK, SK, BP, SP, BPK, SPK), a log will be printed to display the position (number of lines) of signal triggering in the code and the number of signal triggering times.
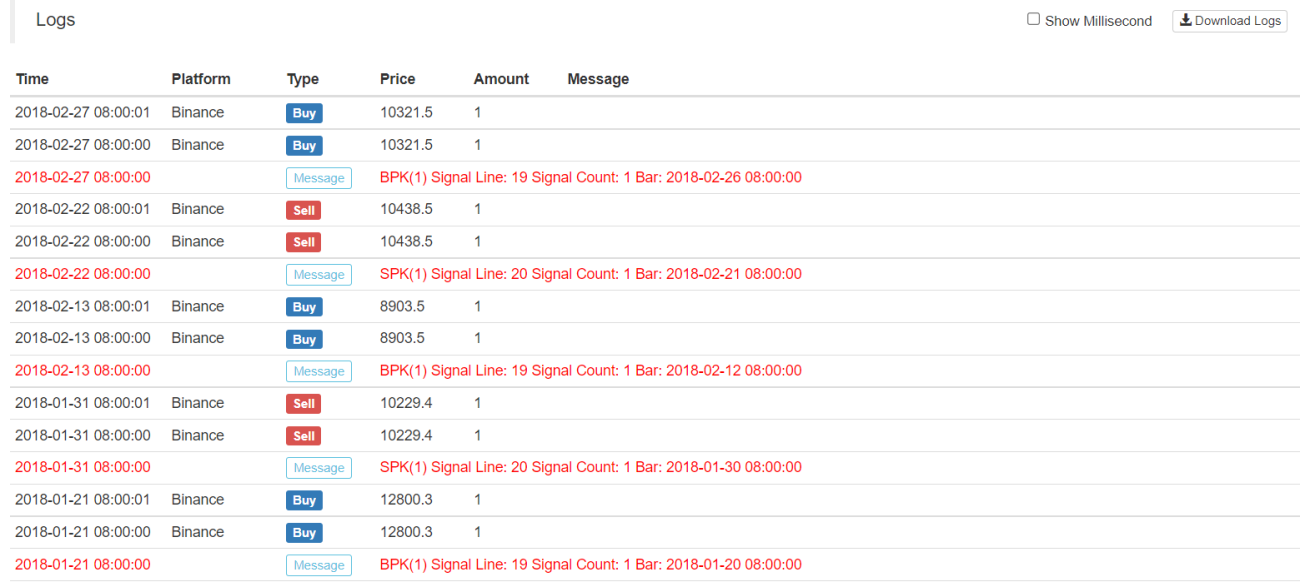
After placing an order log price, quantity, the log will also output the first level price of the current counterparty. For example, when you buy a long position order, the price and quantity of Ask (that is, the level of selling one) order will be displayed.
- 1