

Last year, when Alpha Arena was making the rounds, several AI models were put into live trading environments, and every gain or loss sparked another round of discussion. Quant traders paid especially close attention: after spending so much time researching models and strategies, it was fascinating to see someone simply give the models capital and let them trade.
This year, Jev arrived. I recently came across an open-source project that connects Jev to Kuru's order book on Monad and makes a trading decision roughly once every 300 milliseconds, in step with Monad's block cadence. Both the code and front end are open source. One widely circulated screenshot was especially eye-catching: on one side, people were impressed by the technology; on the other, it said something along the lines of "ran for 14 hours and lost more than 300%." But the screenshot was marked as a dry run, meaning the fills were simulated, and that percentage also depends on the P&L calculation method. It should not be interpreted as a real account literally losing more than three times its initial capital.
Alpha Arena coverage · On-chain trading project source code
After watching all that, I naturally wanted to try it myself. Last year AI trading went viral; this year we have a model designed specifically to make structured judgments. As quant traders, it is hard not to plug something like that into our own strategy and see what happens.
That led to this Binance USDT-margined perpetual strategy running on FMZ. It is currently being tested live on ONE_USDT. Recently I have mainly used it to observe the kind of high-volatility, fast-moving market conditions traders often call "monster-coin" behavior. In these markets, changes in the order book and short-term price action are easier to see, and it is also easier to spot where the strategy and execution logic fail to cooperate.
Below, I will walk through how Jev was integrated, why the strategy was modified along the way, and what became visible only after it started running.
Let Jev Watch the Order Book, but Keep the Division of Labor Clear
Jev's role can be summarized in one sentence: give it the current state, ask several clearly defined questions, and let it return choices, probabilities, or scores that the program can use downstream. For this experiment, that interface is enough.
Short-term traders are familiar with situations like these: the bid side looks thick, yet the price refuses to rise; offers keep getting lifted, but new sell orders keep appearing; the market is quiet, then several aggressive buys hit in succession and the price starts stepping higher. Each of these observations can be turned into an indicator on its own. The difficult part is deciding what they mean when several appear at the same time.
What I wanted to test was whether these clues could be organized into a clean market state and handed to Jev as several specific judgments.
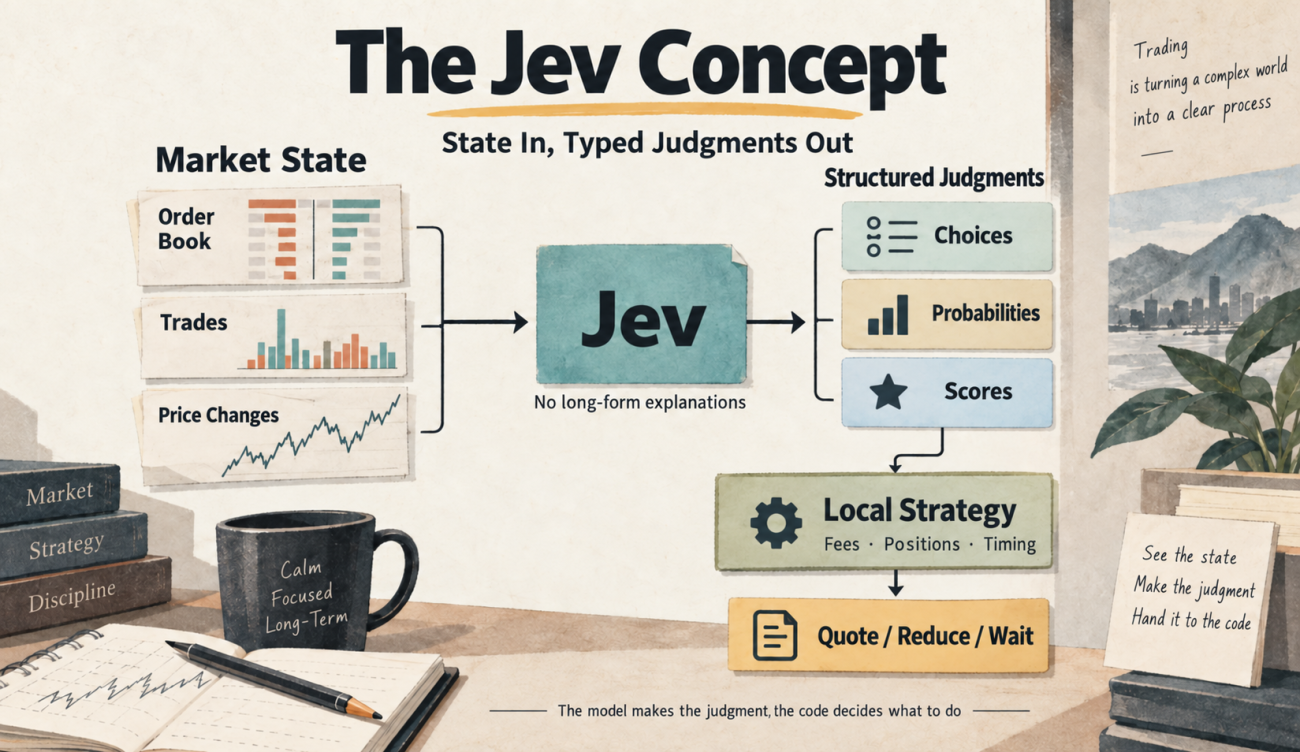
The input sent to Jev mainly includes the order book, recent trades, short-window price changes, and volatility. Missing data is explicitly marked as missing; "we did not receive the data" must not be silently converted into "buying and selling pressure is balanced."
Account positions, order sizes, and trading restrictions are kept local. That way, when a trade does not happen, we can still determine whether the model failed to produce a strong enough signal or whether the order was blocked by fees, position limits, stale market data, or another execution rule.
For execution, the strategy uses passive Maker orders in the hope of getting a better fill price. But anyone who has placed Maker orders knows the trade-off: being right does not guarantee a fill, and when you finally do get filled, it may be because the market has already started moving against you. Most of the later changes revolved around this problem.
The Most Useful Change Was Splitting "Should I Trade?" into Separate Questions
The easiest first attempt is to put market data, fees, and positions into one request and ask, "Should I buy, sell, or wait?" You get an answer, but if the model keeps saying "wait," it is hard to know why.
Does it expect the price to fall? Does it think the upside is too small to cover fees? Is it worried about chasing the move? Is the current position affecting the answer?
After reading How to Use Jev: Three Question Primitives and Layered Thresholds and comparing that approach with the official documentation, the division of labor became much clearer. The most useful idea was to split a large trading decision into several smaller judgments and then combine the answers in code.
The snippets below are taken from the core strategy logic. Some field descriptions, logs, and surrounding checks are omitted for readability.
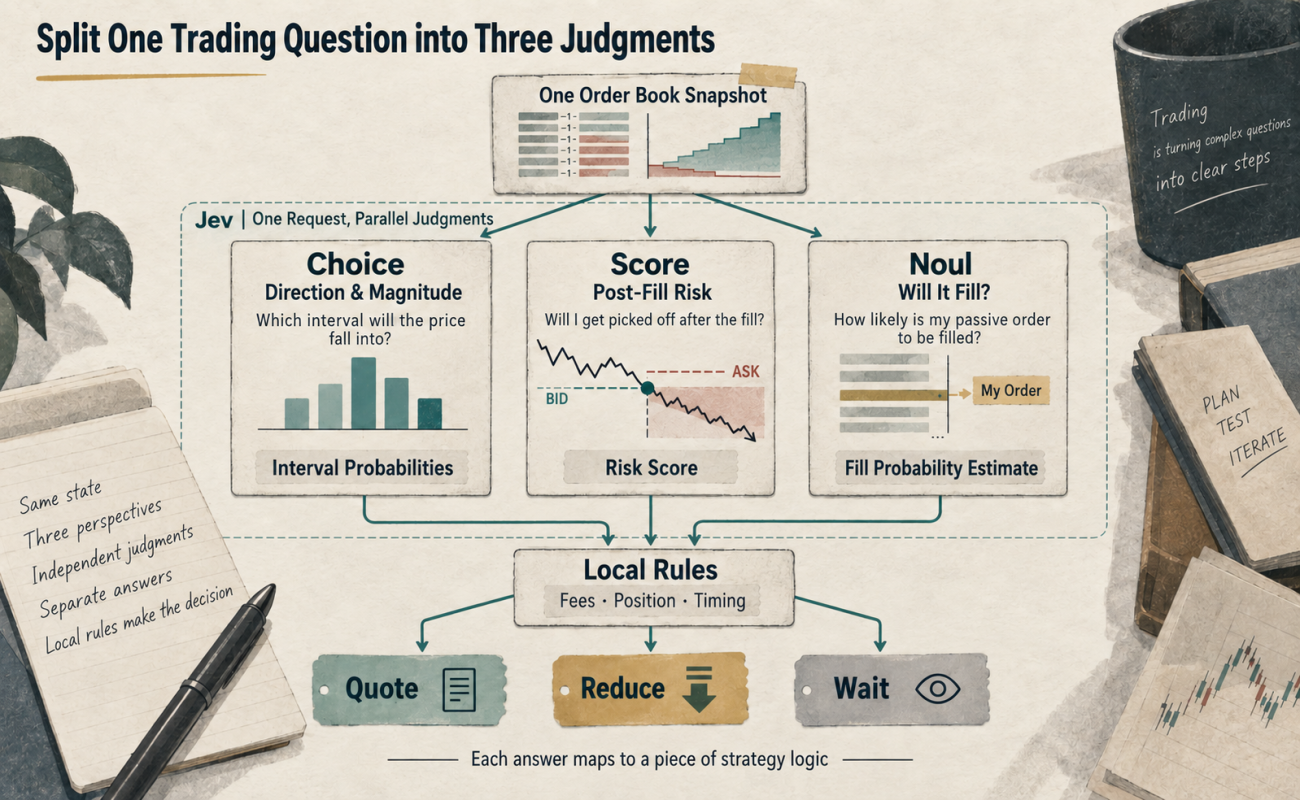
First, ask about direction and magnitude with a Choice question. For example: 30 seconds from now, is the return more likely to fall into a large decline, small decline, narrow-range move, small rise, or large rise?
The program defines these ranges in advance, and the model assigns a probability to each one.
Why ask about magnitude as well as direction? Because we have all seen trades where the direction was correct but there was almost nothing left after costs. Knowing only up or down is not enough.
The strategy asks the same type of question over several horizons. The main trading horizon is 30 seconds; the other horizons are kept mainly for comparison.
javascript
forecastHorizons().forEach(function (h) {
questions["market_" + h] = {
type: "choice",
instructions: {
question: "At " + h / 1000 +
" seconds after state.timestamp, which interval will " +
"R = 10000*(future mid price/state.mid - 1) fall into?"
},
criteria: criteria // Five predefined return intervals
};
});
Next, ask whether getting filled is likely to hurt. This uses a Score question.
A common Maker-order problem on the buy side is that the order refuses to fill, and then the moment it finally fills, the price drops. On the sell side, the mirror image happens: you finally sell, and the price keeps rallying.
So I evaluate the two sides separately and ask how severe the adverse-selection risk would be over the next few seconds after a passive fill.
The score levels should not be vague labels such as "low," "medium," and "high." Each level needs a concrete description: do aggressive trades and price movement point in the same adverse direction? Is there only one warning sign, or are several independent clues pointing the same way?
In the snippet below, book is the best quote on that side. adverse means a decline for a buy order and a rise for a sell order.
            javascript

            questions["toxicity_" + side] = {
    type: "score",
    instructions: {
        question: "If an order at " + book + " is filled, how severe is the risk " +
            "that price moves " + adverse + " by more than " +
            bounds.neutral + " bps within 5 seconds?"
    },
    criteria: [
        "Microprice, aggressive trades, and the realized price path do not point " + adverse,
        "Evidence is conflicting, or there are too few trades / too little depth to judge",
        "Microprice shifts toward " + adverse + " and aggressive flow keeps hitting that side",
        "Microprice, aggressive trades, and the realized price path all point " + adverse
    ]
};
We also need to ask whether the order is likely to fill at all. For that I use Noul.
Noul returns a number between 0 and 1 representing the model's estimated probability that a yes/no statement is true. A value close to 0.5 means the model has no strong preference between yes and no.
Here, that estimate is used to filter entry candidates that appear unlikely to fill and also helps determine the quote placement.
However, the model does not know our true queue position, and a single order-book snapshot cannot reconstruct the full sequence of cancellations and fills. So the number has to be checked against actual order records later rather than treated as ground truth.
            javascript

            questions["fill_" + side] = {
    type: "noul",
    instructions: {
        question: "If we place at " + book + ", will the order be filled within the next " +
            Math.round(CFG.signalTtlMs / 1000) + " seconds?"
    },
    criteria: {
        "true": "The passive order will be hit by the opposing side",
        "false": "The passive order will remain unfilled"
    }
};
Putting these three question types into one request gets much closer to the way a trader actually thinks while watching the book:
- What do direction and magnitude look like?
- If I place the order, is it likely to fill?
- If it fills, am I likely to regret the fill immediately?
Once the answers come back, the program uses them in different places: whether the directional signal is strong enough to open a position, whether fill probability is too low, and whether higher adverse-selection risk should move the quote to a more favorable price.
Splitting the decision this way also gives us something concrete to debug. If quoting is too aggressive, inspect the risk score and quote-placement logic. If no orders ever appear, inspect which condition keeps failing.
When the Market Gets Wild, a Fixed Ruler Stops Working
While running the strategy on ONE, one thing became obvious: short-term market features are easier to see. Changes in buying and selling pressure, bursts of trades, sharp rallies, and pullbacks all become visible over relatively short windows.
But large moves also magnify the weaknesses in passive quoting and exits.
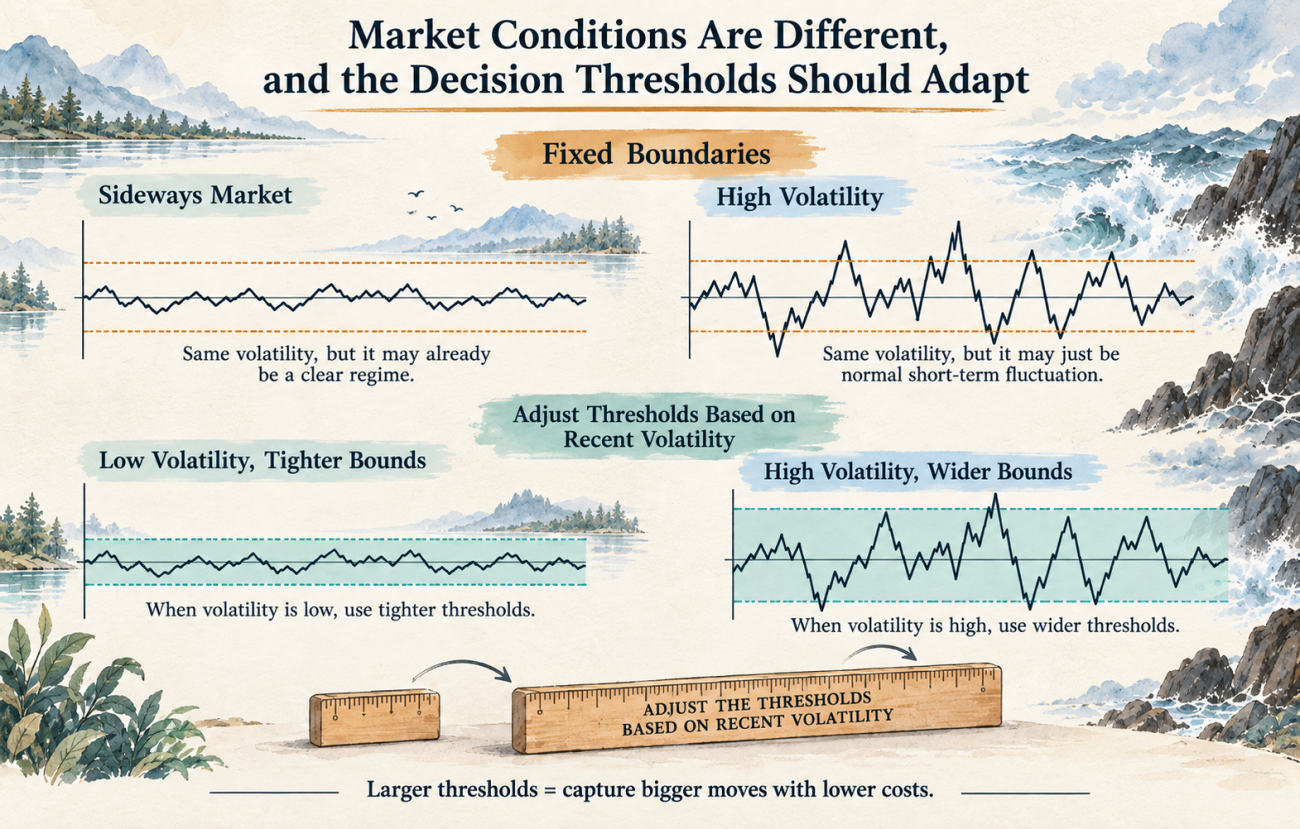
The first thing that needed to change was the ruler used to define price-move magnitude.
A move that counts as a meaningful rise in a quiet market may be nothing more than ordinary noise in a token that is moving violently. If every instrument uses the same fixed boundaries, the model may still answer "large rise," "small rise," or "sideways," but those labels correspond to very different market conditions.
The strategy previously spent long periods doing nothing. After checking the logic, the reason was fairly straightforward: on one hand, we were asking the model to predict a fairly large move over a very short horizon; on the other, we also required the model to be quite confident about it. When those conditions do not match the current volatility regime, waiting for a long time without a trade is perfectly normal.
The return-interval boundaries were therefore changed to adapt to recent volatility, while preserving a floor based on fees and safety buffers.
The lines below determine the initial boundary for a "large move." Upper and lower constraints are applied afterward. The volatility scaling is only an approximation, especially in markets with jumps and abrupt reversals; it should not be interpreted as a precise forecast of future move size.
            javascript

            VOL.sigmaHorizonBps = VOL.sigma1mBps *
    Math.sqrt(CFG.signalHorizonMs / 60000);

var z = inverseNormal(1 - CFG.tailTargetRate);

var outer = Math.max(
    z * VOL.sigmaHorizonBps,
    minimumEdgeBps()
);
Cancel-and-requote logic has the same problem. If the strategy cancels every time the price moves slightly, it may look responsive while constantly throwing away queue position.
So the requote distance also needs to account for volatility and the instrument's minimum tick size.
I will not go through every parameter one by one. Price precision, quantity precision, and minimum-order requirements should be read from the exchange whenever possible. Distances that can be estimated from live market data should adapt automatically. The human mainly decides what to trade, how much to trade each time, and the maximum allowed position.
That reduces manual configuration mistakes when switching instruments, although the actual behavior still needs to be evaluated instrument by instrument.
A Bearish Model Does Not Automatically Mean "Open a Short Now"
Another useful idea from the reference material is that different actions should have different thresholds.
Suppose we already hold a long position and the model starts leaning bearish. That evidence may not yet be strong enough to justify opening a new short position, but it may already be strong enough to reduce part of the long.
The code therefore separates the directional probability threshold for opening a new position from the threshold for reducing an existing position.
Opening new exposure requires a stronger judgment. The strategy also checks whether the probability distribution is too diffuse and whether the passive fill probability is too low.
Reducing exposure uses a lower directional threshold.
The lines below show the core threshold-selection logic. Market-data validity, signal freshness, and the other safeguards still run around this block.
Official confidence documentation
            javascript

            var required = plan.reducing
    ? CFG.reduceThreshold
    : CFG.openThreshold;

decision.requiredProbability = required;

if (tail < required) {
    decision.reasonCode = "probability";
    return decision;  // Keep the default action: wait
}
The dashboard follows the same division of labor.
The Signals & Decisions panel puts the directional probability, entry and reduction thresholds, fill estimates for both sides, and adverse-selection scores in one place. The final column states why the current decision was made.
With that table, we can trace a local execution decision back to the model outputs instead of guessing why the system keeps waiting.
The Prediction Probabilities by Horizon section expands the different time scales so we can compare the model's view over short and slightly longer horizons.
One distinction matters here: the directional probabilities correspond to specific market events, while confidence measures how concentrated the answer distribution is. Confidence should not be interpreted directly as a trading win rate.
Likewise, a bullish or bearish prediction still has to pass the local execution checks before it can become an order.
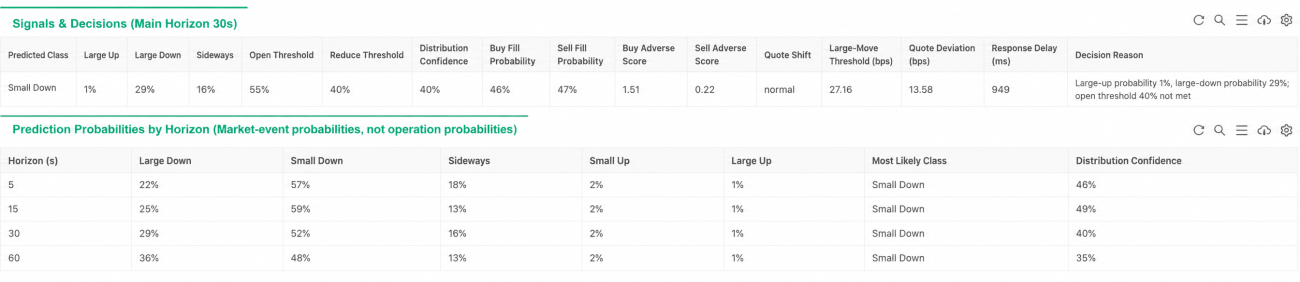
Figure 1: Signal section captured from the live strategy dashboard. The upper section checks trading conditions; the lower section compares market judgments across multiple horizons. Values update while the strategy is running.
Once It Is Running, You Need to See What It Is Actually Doing
The strategy is already running live, and the dashboard is mainly there to help identify problems.
For example, when the model makes a prediction, once the forecast horizon has elapsed the strategy records which interval the realized price actually landed in. This appears in the Prediction Validation section.
For each horizon, it shows the sample count and five-class accuracy. It also includes a simple baseline that always predicts the narrow-range class.
A Brier score is displayed alongside the accuracy figures to evaluate the error of the full probability distribution. Non-overlapping samples are also tracked to reduce the problem of many consecutive forecasts covering nearly the same market interval.
Each metric tells us something different. No single number should be used to judge the entire strategy. Looking at them together makes it easier to identify which horizons and which market regimes deserve deeper investigation.
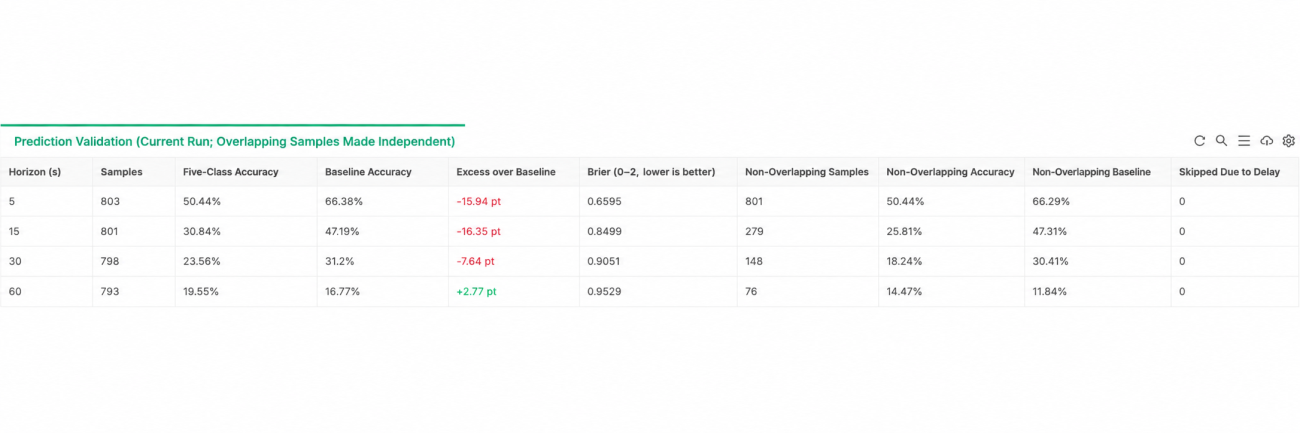
Figure 2: Prediction-validation panel. It uses the same return-interval definitions to compare the model's judgments with realized price action, while retaining a simple baseline and non-overlapping samples for later review.
Passive fill quality needs to be evaluated separately, so the dashboard also contains a Post-Fill Price Performance section.
It records the price move at several timestamps after a fill is detected. After a buy, a price rise is considered favorable; after a sell, a decline is favorable. The opposite direction is adverse.
If the market frequently moves against the order immediately after a fill, we can go back and check whether the quote was too aggressive or whether the adverse-selection score actually helped.
This measurement starts from the time the local program detects the fill. It does not subtract fees. Its purpose is to observe whether passive Maker orders are systematically exposed to adverse selection, not to report the net P&L of each trade.
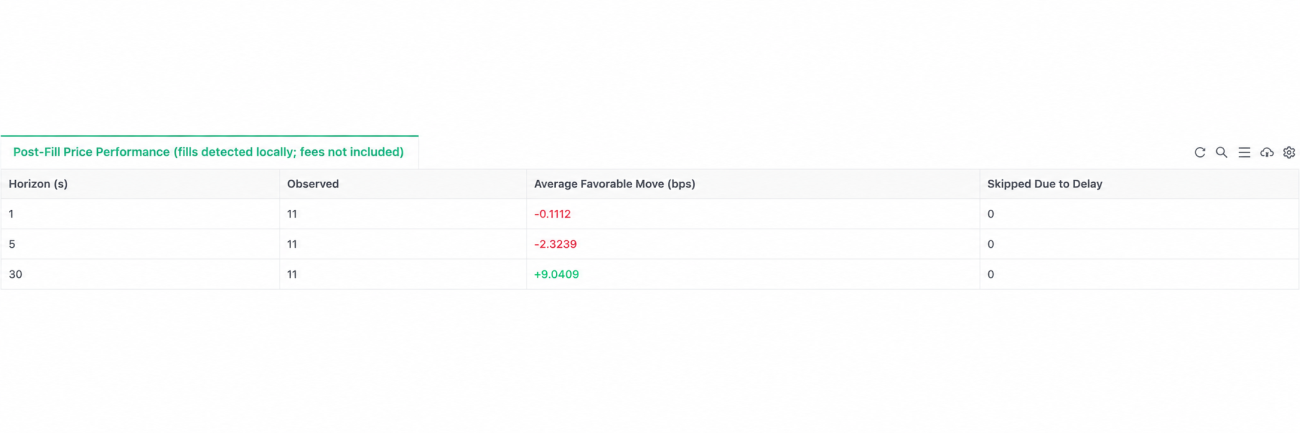
Figure 3: Post-fill price-performance panel. It keeps the short-term price path after each fill so it can be compared with the earlier risk score and quote-selection logic.
When debugging, I also compare the Order Book & Order Flow, Data & Request Health, and order-history sections.
The first tells us what the model was seeing at the time. The health checks tell us whether the data was fresh and whether requests were failing. Position and order records tell us how far the execution actually progressed.
If there was a signal but no order, first inspect the decision reason and the data state. If an order was placed but never filled, then inspect the quote and the fill-probability estimate.
Read this way, each dashboard panel maps back to a specific piece of strategy logic described earlier.
There are still important things missing from the current implementation.
After a position exceeds its time budget, the strategy attempts to place a Reduce Only Maker order, but placing the order does not mean the position will be closed immediately. A complete hard stop-loss, daily-loss circuit breaker, and liquidation-distance check have not yet been added.
As I continue running the strategy, what I most want to understand is where Jev provides useful information about order-book states, and how much of that value survives the transition from a model judgment to a real passive order.
By keeping the input, judgment, execution, and validation records, there is something concrete to review afterward—and a much clearer answer to what should be changed next.
Strategy source: Jev Binance USDT-Margined Perpetual Decision Trading (Version 3.0)
- 1