
Summary
Quantum footprint chart is an advanced chart analysis tool, the English name is "Footprint Charts". It shows the trading activity of each price in a single K line. In addition to providing price information, it also provides information such as transaction volume, active buying, and active selling. It is a multi-dimensional technical chart that reveals the true distribution ratio of each price based on trading volume, explains the complex relationship between trading volume, price and time, and can provide more reference for traders.
What is Quantum Footprint
Simply put, Quantum Footprint provides market transparency by micro-analysing what happens to buyers and sellers at various price levels. What do you see in the graph of calorie footprint diagram:
- K-line price
- Active Buy Volume (ASK)
- Active Sell Volume (BID)
- Equilibrium ratio
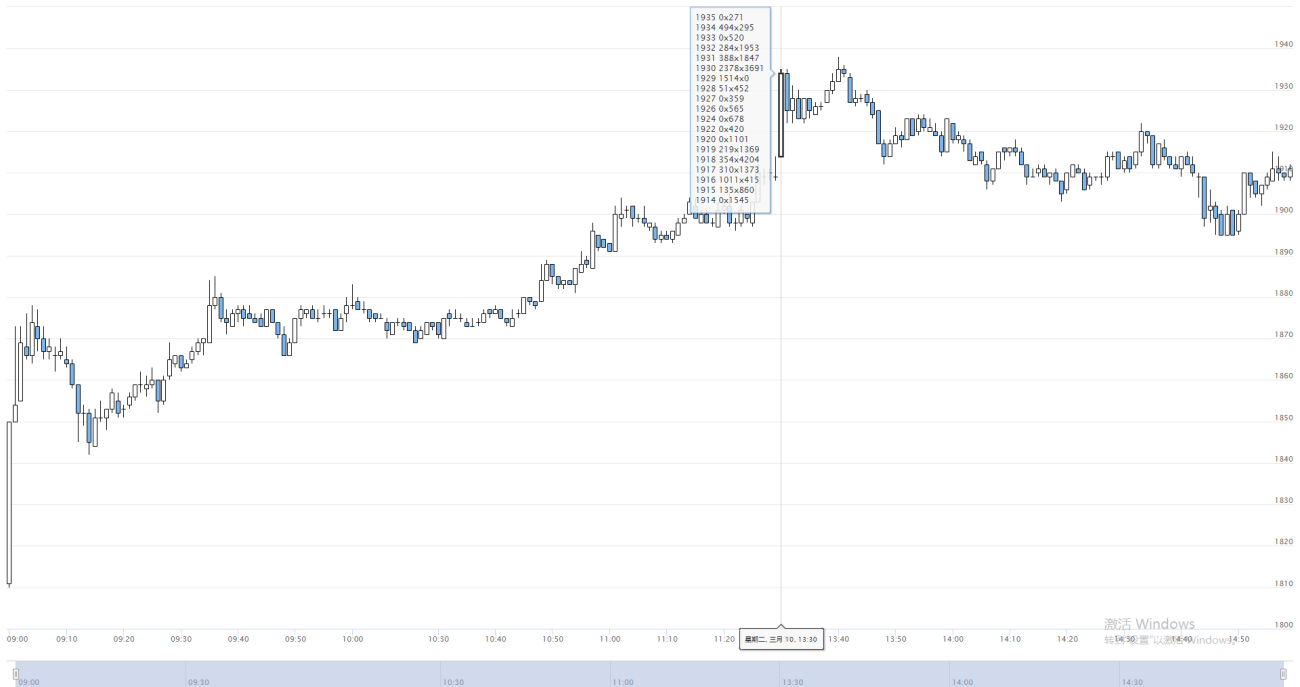
As shown in the figure above, this is a demonstration version of the quantitative energy footprint chart implemented on the trading platform FMZ.COM. It is calculated based on the actual tick market. Detailed data are attached to the K line. When the mouse hovers over On the K line, the quantitative energy footprint data can be presented. The data in the blue square is its calculation result, which is divided into two columns in total, and the left column is all the price points of the current K line, which are arranged in order from large to small. The right column is the trading volume for each price level, subdivided into buying trading volume and selling trading volume, separated by "x". On the left of "x" is the volume of active buying, on the right of "x" is the volume of active selling.
The role of Quantum Energy Footprint
Think about what caused the price increase? The answer is simple... buyers and sellers. If there are more buyers than sellers, the price will rise; if there are more sellers than buyers, the price will fall. If the current number of sellers is approximately equal to the number of buying prices, then the market will show a volatile trend, that is, the market is in a balanced state. Once large buyers or sellers appear, this balance will be broken, and then the energy footprint map will show an extreme ratio of active buying and selling.
The energy footprint is dynamically displayed based on Tick data, so it is especially suitable for short-term intraday trading. Traders can accurately see the active trading volume on each price to explain the reasons or laws of price fluctuations and customize their own trading strategies. For example: if the buying volume on the left is much larger than the selling volume on the right, it means that market participants are actively buying, and the price may increase in the future; otherwise, if the selling volume on the right is much larger than the buying volume on the left, it means With market participants actively selling, prices may fall in the future.
Principle of Quantum Energy Footprint
The calculation principle of the Quantum Energy Footprint comes from the volume and market data. The current volume is calculated in real time according to the price changes of the market. If the market price rises, the volume is recorded as an active buying; if the market price falls, Then record the volume as actively selling. In the FMZ energy footprint graph, Tick data will be calculated in real time to accurately calculate the turnover of each Tick.
Quantum Energy Footprint Code Implementation
/*backtest
start: 2020-03-10 00:00:00
end: 2020-03-10 23:59:00
period: 1h
exchanges: [{"eid":"Futures_CTP","currency":"FUTURES"}]
mode: 1
*/
var NewFuturesTradeFilter = function (period) {
var self = {} // Create an object
self.c = Chart({ // Create "Chart" chart
tooltip: {
xDateFormat:'%Y-%m-%d %H:%M:%S, %A',
pointFormat:'{point.tips}'
},
series: [{
name: exchange.GetName(),
type:'candlestick',
data: []
}]
})
self.c.reset() // clear chart data
self.pre = null // used to record the last data
self.records = []
self.feed = function (ticker) {
if (!self.pre) {// If the previous data is not true
self.pre = ticker // Assign the latest data
}
var action ='' // Mark as empty string
Log('ticker', ticker)
Log('pre', self.pre)
if (ticker.Last >= self.pre.Sell) {// If the last price of the latest data is greater than or equal to the selling price of the previous data
action ='buy' // mark as buy
} else if (ticker.Last <= self.pre.Buy) {// If the last price of the latest data is less than or equal to the bid price of the previous data
action ='sell' // mark as sell
} else {
if (ticker.Last >= ticker.Sell) {// If the last price of the latest data is greater than or equal to the selling price of the latest data
action ='buy' // mark as buy
} else if (ticker.Last <= ticker.Buy) {// If the last price of the latest data is less than or equal to the buying price of the latest data
action ='sell' // mark as "sell"
} else {
action ='both' // Mark as "both"
}
}
// reset volume
if (ticker.Volume <self.pre.Volume) {// If the volume of the latest data is less than the volume of the previous data
self.pre.Volume = 0 // Assign the volume of the previous data to 0
}
var amount = ticker.Volume-self.pre.Volume // the volume of the latest data minus the volume of the previous data
if (action !='' && amount> 0) {// If the tag is not an empty string and the action is greater than 0
var epoch = parseInt(ticker.Time / period) * period // Calculate the K-line timestamp and round it
var bar = null
var pos = undefined
if (
self.records.length == 0 || // If the K-line length is 0 or the last K-line timestamp is less than "epoch"
self.records[self.records.length-1].time <epoch
) {
bar = {
time: epoch,
data: {},
open: ticker.Last,
high: ticker.Last,
low: ticker.Last,
close: ticker.Last
} // Assign the latest data to bar
self.records.push(bar) // Add bar to the records array
} else {// reassign bar
bar = self.records[self.records.length-1] // the last bar of the previous data
bar.high = Math.max(bar.high, ticker.Last) // the maximum price of the last bar of the previous data and the maximum value of the last price of the latest data
bar.low = Math.min(bar.low, ticker.Last) // The minimum price of the last bar of the previous data and the minimum value of the last price of the latest data
bar.close = ticker.Last // last price of latest data
pos = -1
}
if (typeof bar.data[ticker.Last] ==='undefined') {// If the data is empty
bar.data[ticker.Last] = {// reassign value
buy: 0,
sell: 0
}
}
if (action =='both') {// If the token is equal to both
bar.data[ticker.Last]['buy'] += amount // buy accumulation
bar.data[ticker.Last]['sell'] += amount // sell accumulated
} else {
bar.data[ticker.Last][action] += amount // mark accumulation
}
var tips =''
Object.keys(bar.data) // Put the keys in the object into an array
.sort() // sort
.reverse() // Reverse the order in the array
.forEach(function (p) {// traverse the array
tips +='<br>' + p + '' + bar.data[p].sell +'x' + bar.data[p].buy
})
self.c.add( // Add data
0, {
x: bar.time,
open: bar.open,
high: bar.high,
low: bar.low,
close: bar.close,
tips: tips
},
pos
)
}
self.pre = ticker // reassign
}
return self // return object
}
// program entry
function main() {
Log(_C(exchange.SetContractType,'MA888')) // subscription data
var filt = NewFuturesTradeFilter(60000) // Create an object
while (true) {// Enter loop mode
var ticker = exchange.GetTicker() // Get exchange tick data
if (ticker) {// If the Tick data is successfully obtained
filt.feed(ticker) // Start processing data
}
}
}
Quantum Footprint Code Download
The quantitative code footprint chart strategy code has been released on the FMZ.com platform, and ordinary users can use it without setting.
https://www.fmz.com/strategy/189965
To sum up
In actual use, the energy footprint map can also analyze the flow of funds from the perspective of volume. Whether it is to analyze the direction of large-scale trends or the short-term direction of the day, it plays a vital role. However, it should be noted that the so-called capital flow here does not refer to the entry and exit of funds, but rather reflects the market's willingness to buy and sell and the game behavior of the main players and retail investors.
- 1