

Visualization Module to Build Trading Strategy - First Acquaintance
Visual programming has always been an aspirational goal of software developers, even in the field of quantitative trading.
Because the method of "what you see is what you get" in visualization reduces the technical threshold of programming development greatly.
Users no longer have to deal with a pile of boring codes. They just use their imagination and logical thinking to focus on the business itself.
You can realize a program you want. Isn't it amazing?
Let's get into the visual programming field of quantitative trading strategy together!
Visual programming of the initial FMZ Quant
After logging in to https://www.fmz.com, register your account (if you are already registered, log in directly) and click: Dashboard ->Strategy ->Add Strategy.
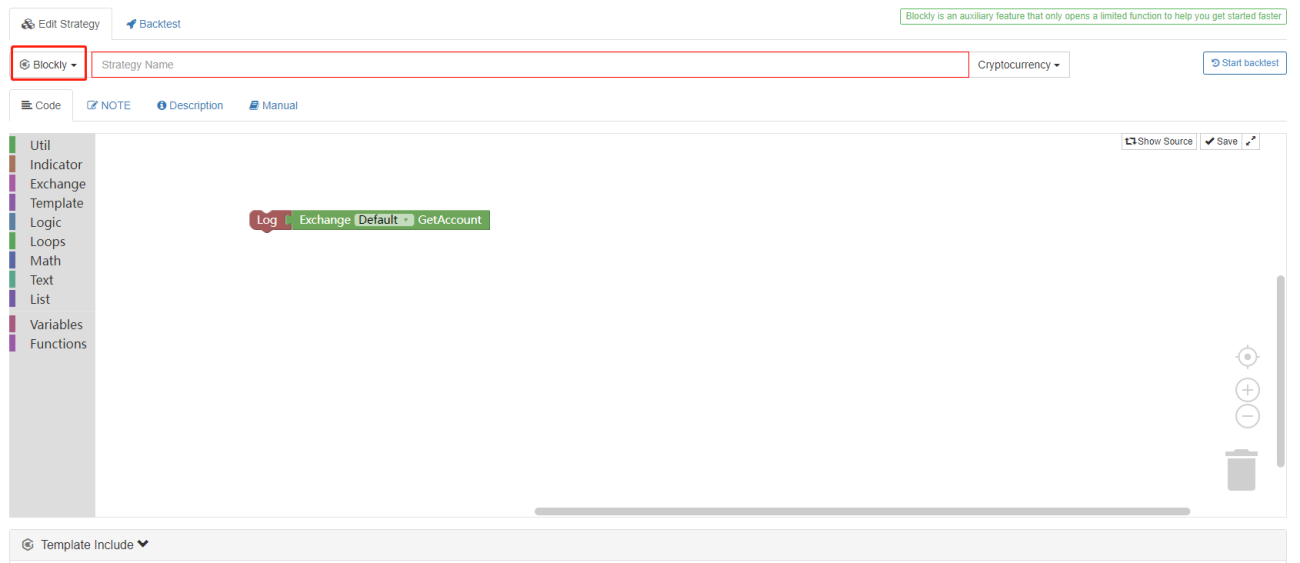
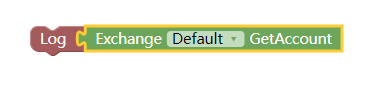
We can see an initial visualization strategy.
It is only used to output the account asset information of the default configured exchange (the first exchange object added on the backtest or robot).
(See the figure below)
Before we start learning how to use visualization, we can understand some design concepts of visualization.
- Splicing
If you look carefully, you can see that modules have tenon (concave) and mortise (convex), i.e. modules can "connect" and "be connected".
If two modules represent functional codes that can be connected, then the tenons and mortises of the two modules will be attracted together when you bring them close.
- Module setting and adjustment
Some modules have some special settable areas, for example:
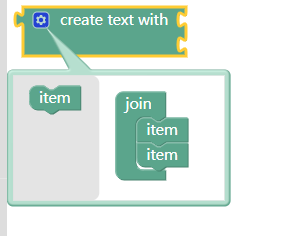
You can drag the "Item" module on the left to the "Add" module, so that you can add a tenon (concave) position, thus adding a position for splicing text.
In this way, click the pinion to adjust and set the module.
- Default input parameters of the module
Some modules need to input some parameters, which may be numeric values or strings.
If you do not add variables as input parameters of the module, the module will execute according to the default input parameters.
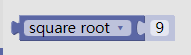
The square root calculation module like this outputs the calculation results of this module.
As you can see, if the input parameter position defaults, the default value 9 will be used as the input parameter to calculate the square root of 9.
Of course, if you want to use a variable module as the input parameter, you can splice the variable module into the tenon (concave) position directly.
- Operation
The module can be clicked and dragged with the left mouse button.
Modules can be copied with ctrl+c and pasted with ctrl+v, just as convenient as copying and pasting code or text.
The operation area can be scaled with the mouse wheel, and all modules will be scaled larger or smaller.
Click and drag the blank position in the operation area to move the operation area.
The trash bin on the right side records the recently deleted modules.
The most important thing is that after splicing the module strategy, don't forget to click "Save".
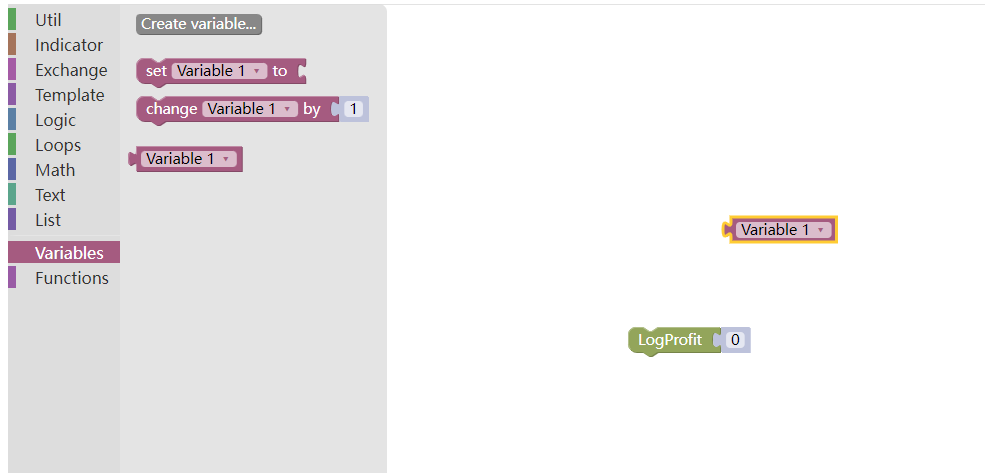
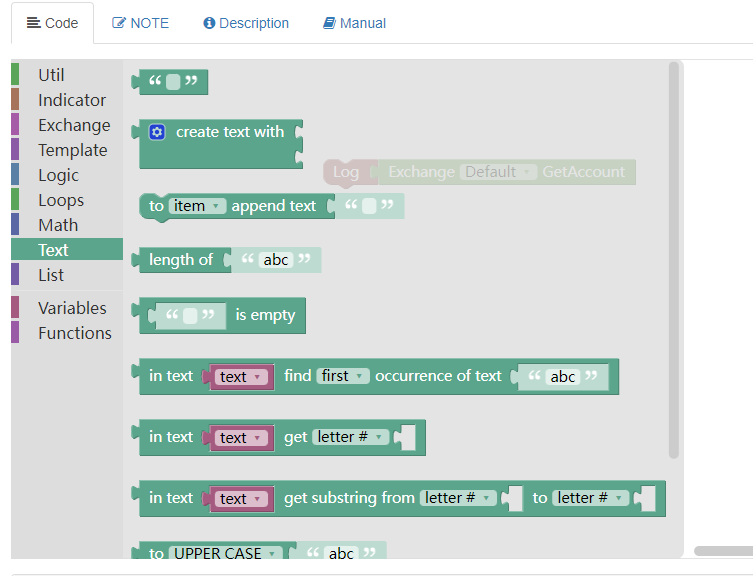
Introduction to visualization tool module
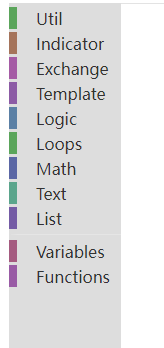
You can see that there are many module classifications on the left side of the visual editing area, and there are many visual modules available in each classification project.
There are 11 categories.
Util module:
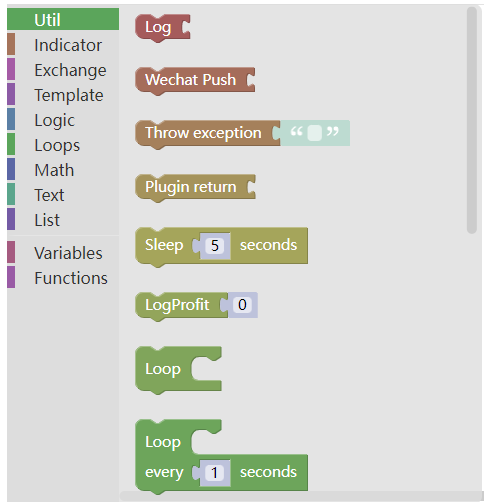
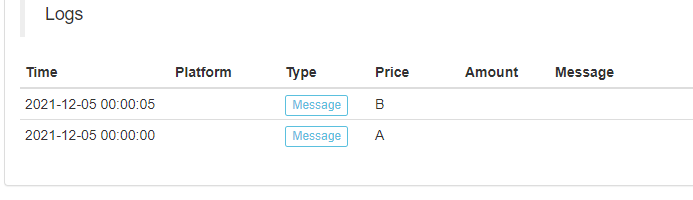
- Output information:
This module is usually used together with the module of text class, as shown below:
You can enter a string in the text module, so that when you run the Output Information module, the string content in the text module will be printed.
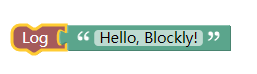
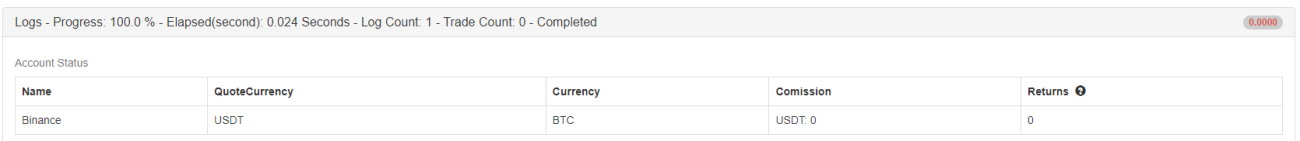
Backtesting:

Like JavaScript language code:
function main(){
Log("Hello, Blockly!")
}
- WeChat push:
This module has the same appearance as the "output information", which is different from the one that pushes information to WeChat bound to the current account at the same time.
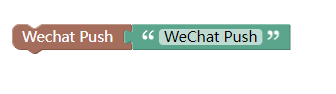
Like JavaScript language code:
            function main () {
Log("WeChat Push!@")
}
- Throw exception
Throwing exception module causes the program to issue an error, and then the program stops execution (without writing the exception handling code).
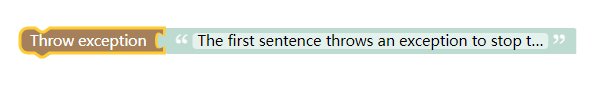
Similarly, in the JavaScript strategy, the main function executes the throw "string to output" function directly.
            function main () {
    throw "The first sentence throws an exception to stop the program!"
}
Backtesting results:
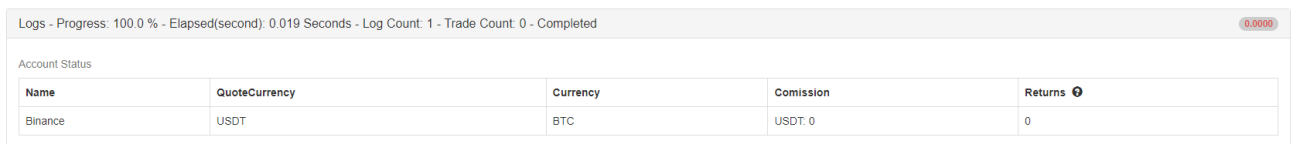
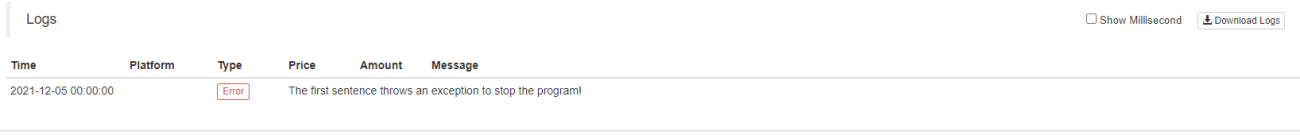
Generally, it is used more when debugging. For example, if you want the program to stop under certain conditions and print some data at that time for observation.
Or you can place an exception module in the code flow where problems may occur, let the program report errors, and find some errors.
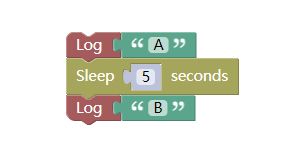
- Sleep
Sleep module

As in JavaScript strategy:
            function main () {
    Sleep(1000 * 5)
}
Test the sleep module:
Backtesting results:
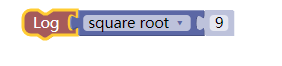
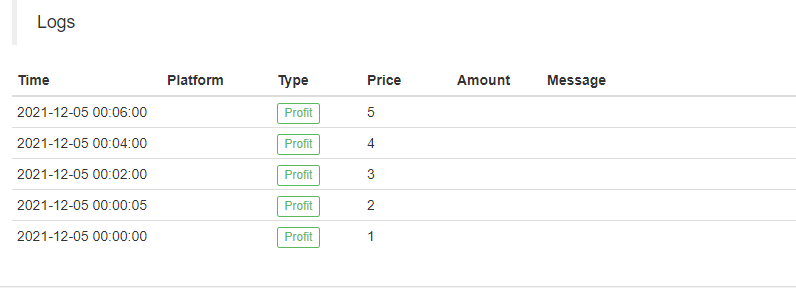
- Print returns

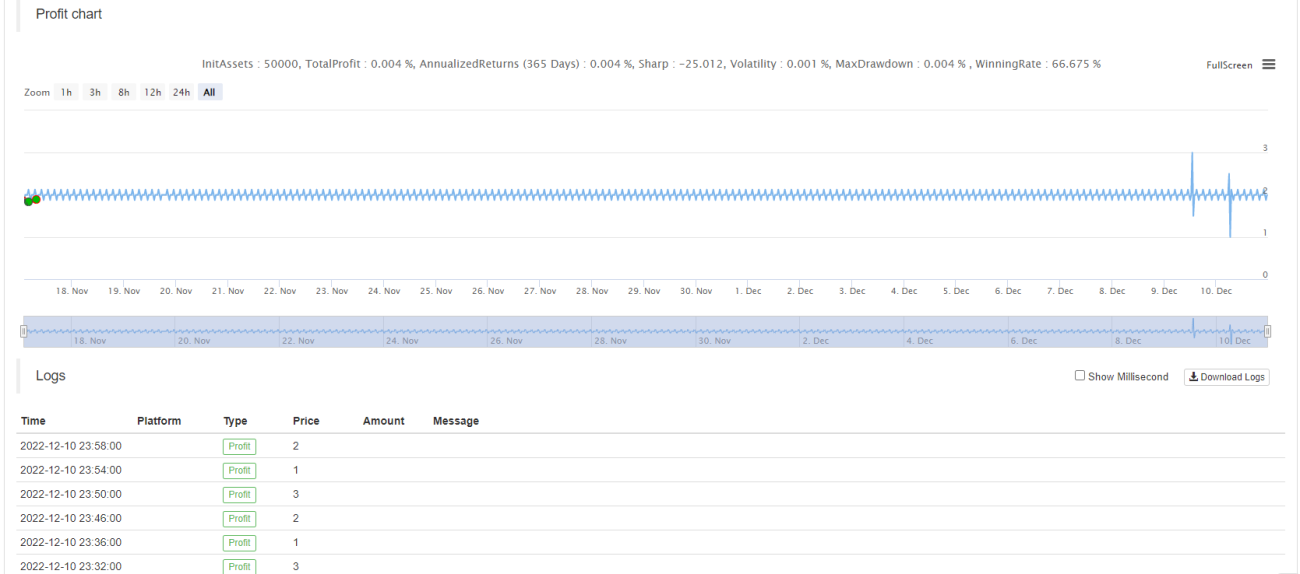
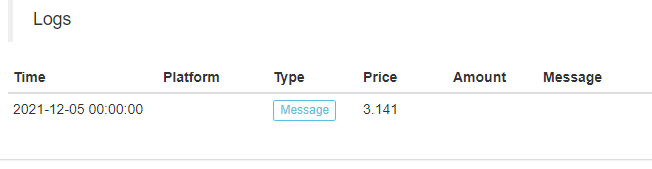
This module, just like the API function LogProfit on FMZ Quant Trading Platform, which prints the returns log and draws the return curve according to the input parameters automatically.
For example:
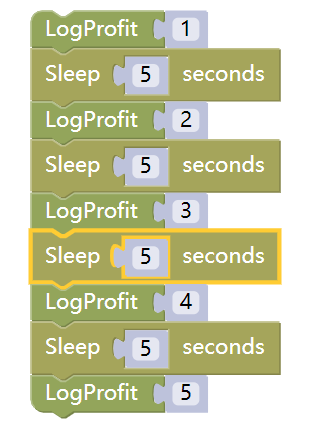
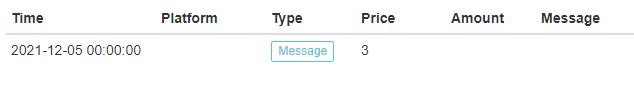
The execution of the backtesting is shown in the figure below:
The corresponding JavaScript strategy code is as follows:
            function main () {
    LogProfit(1)
    Sleep(1000 * 5)
    LogProfit(2)
    Sleep(1000 * 5)
    LogProfit(3)
    Sleep(1000 * 5)
    LogProfit(2)
    Sleep(1000 * 5)
    LogProfit(5)
}
It can be spliced at any position where you want to output return information.
- Loop

Loop module can wrap a series of spliced module combinations, allowing the module combinations to execute the loop.
Test:
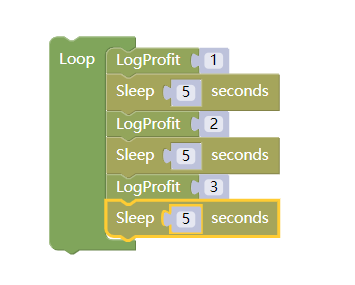
Backtesting results:
We can see that the module combination consisting of "print returns" and "sleep" will be executed continuously after the loop module is wrapped.
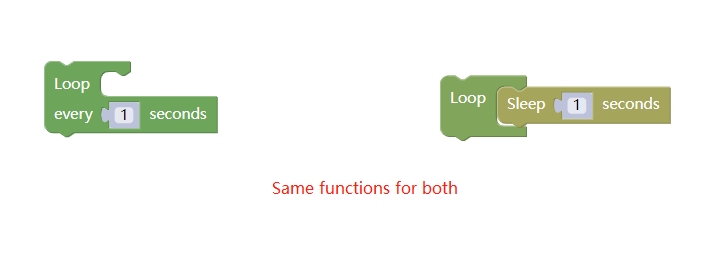
-
Loop execution every N seconds

The usage of this module is basically the same as that of the loop module. The only difference is that the module has its own sleep.
-
Precision processing
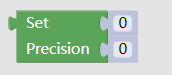
This module can be used when the variable module or numerical value needs to control the precision. The numerical value of the input parameter part will be output as the numerical value of the specified decimal place according to the settings.
For example, precision processing is performed on the value 3.1415926535897.
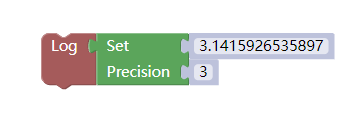
Backtesting display:
- Clear Log
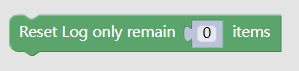
It is used to clear logs. Some logs can be retained according to the input parameters.
As in the API document:
LogReset()
- Clear return log
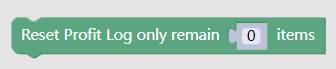
It is used to clear the return log. Some logs can be retained according to the input parameters.
As in the API document:
LogProfitReset()
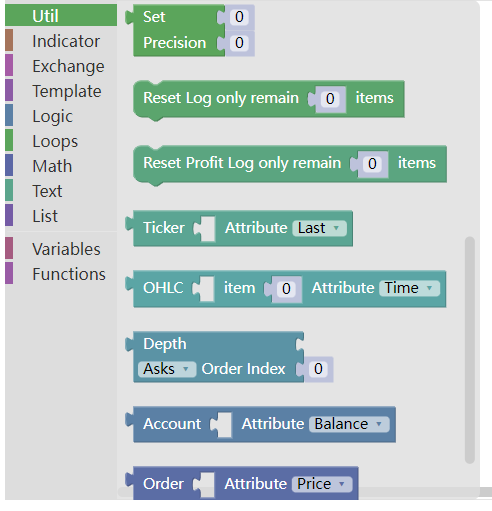
The next are some frequently used tool modules
- Function module for obtaining a certain attribute of the market
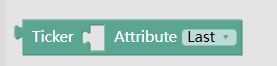
This tool module needs to be used together with the quotation module in the "Transaction Module Type", as shown in the figure:
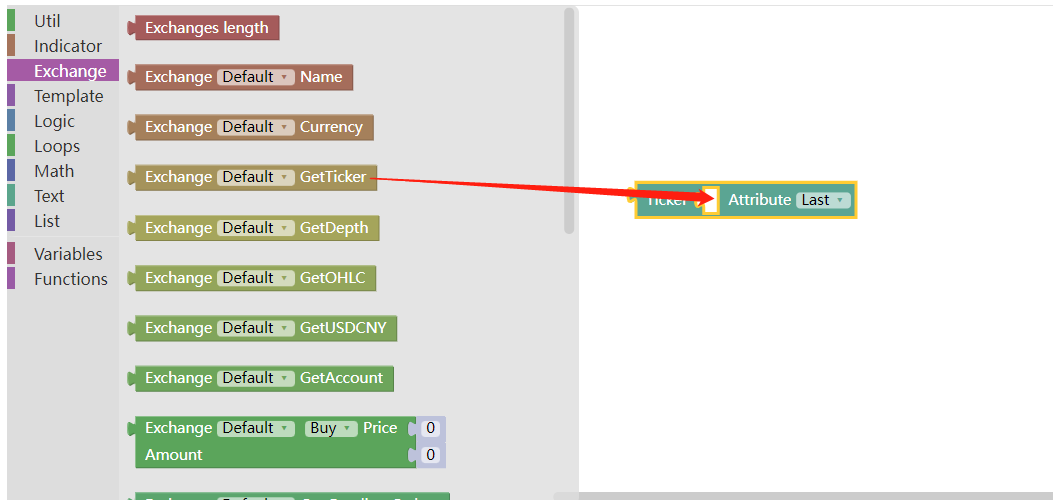
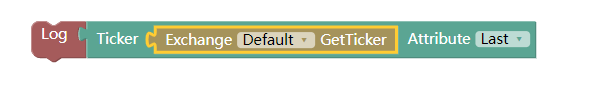
Use the output information module to output the latest transaction price of the latest ticker market:
Backtesting display:
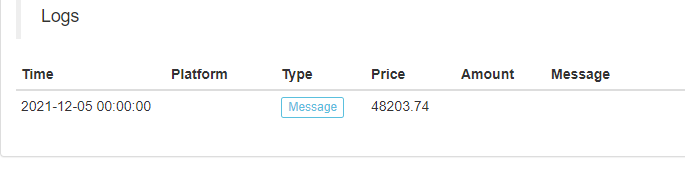
Like JavaScript strategy code:
            function main () {
    Log(exchange.GetTicker().Last)
}
- The module that obtains the attribute of a bar of K-line data

This module also needs to be used together with the K-line data acquisition module in the "Transaction Module Type".
First, we create a variable module named K-line.
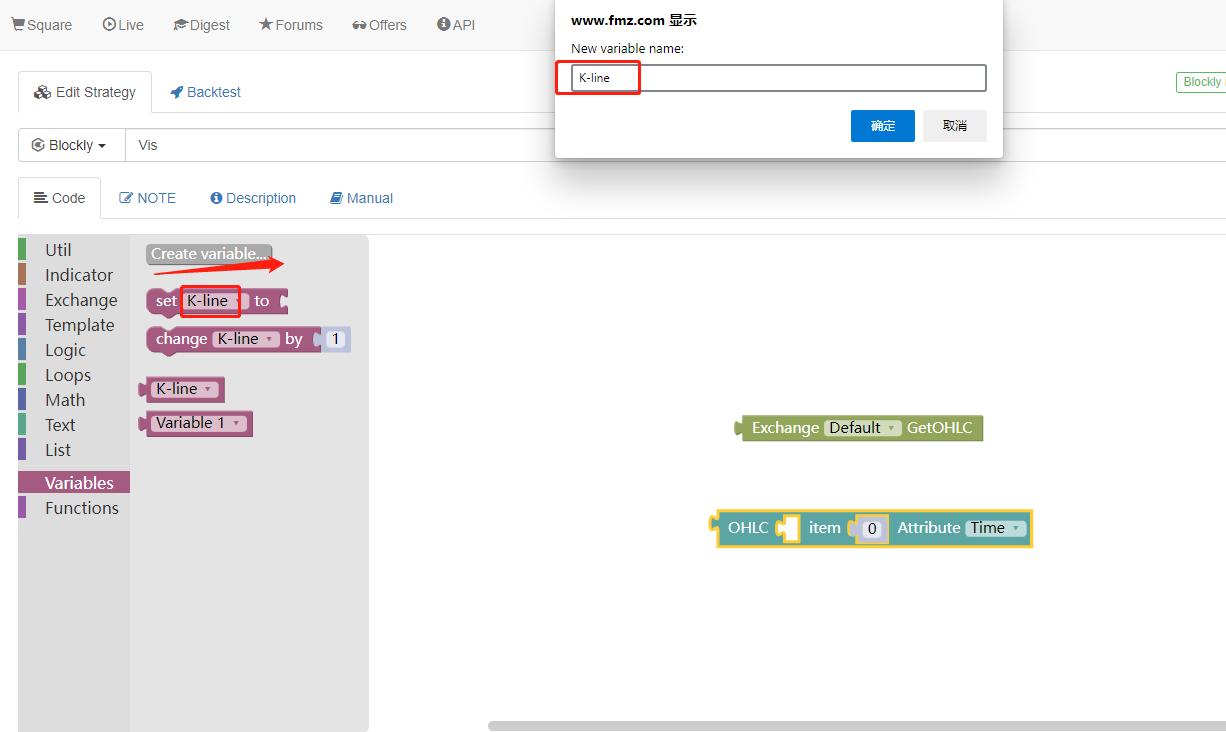
Then we obtain the K-line data, use the K-line data module to obtain it, and assign the value to the variable module: "K-line".
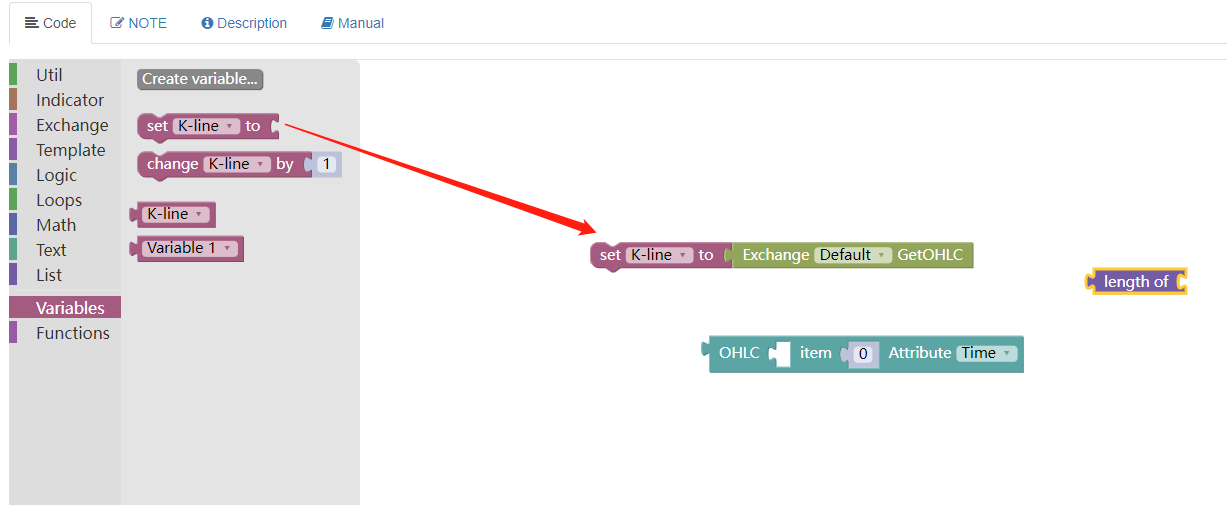
Then we use the list length module in the "List Module Type" to obtain the length of the K-line variable module, which is used to specify which bar on the K-line to obtain the data.
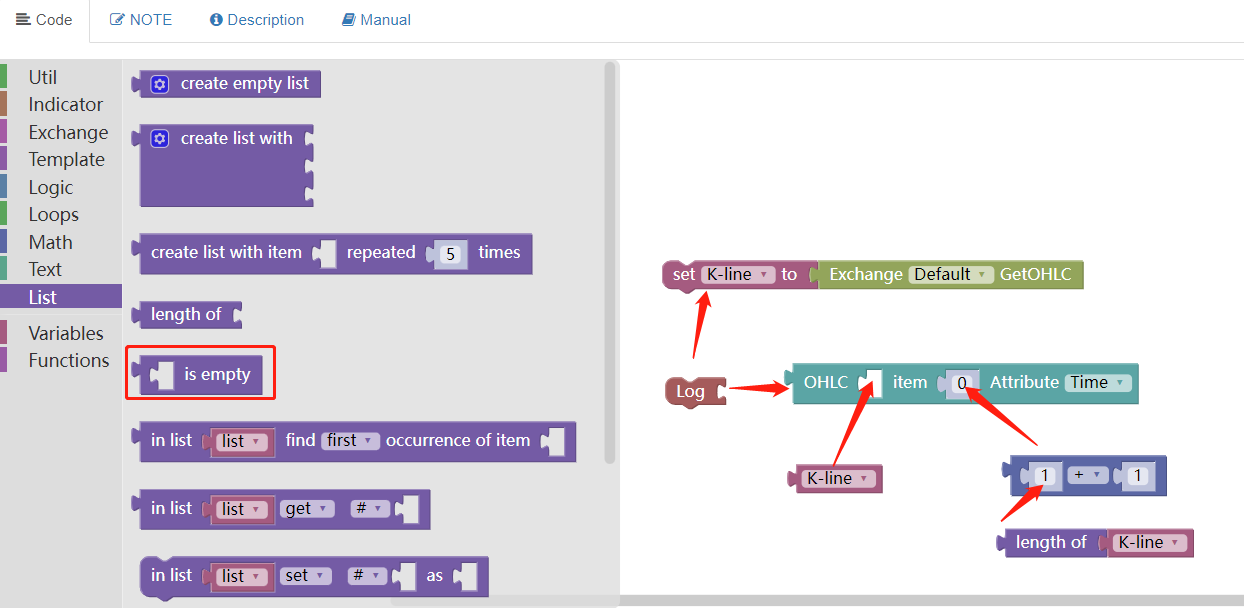
Splice them together, as shown in the figure:
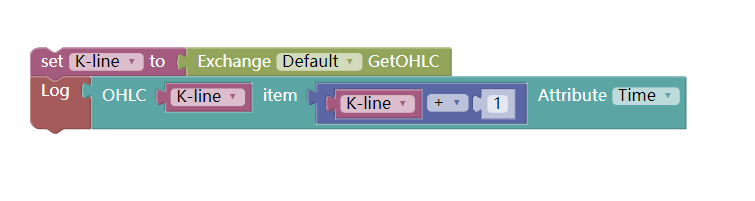
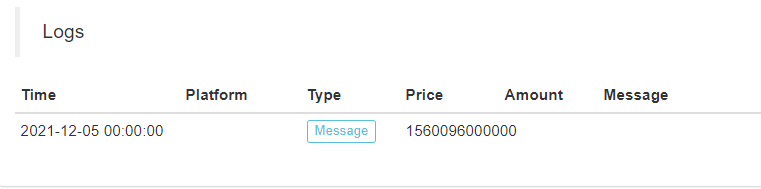
The timestamp of the last K-line bar is printed when the backtest runs.
- The module that obtains the data of an order in the order book
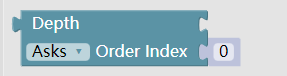
It also needs to be used together with the "Get Depth Data module" in the "Transaction Module Type".
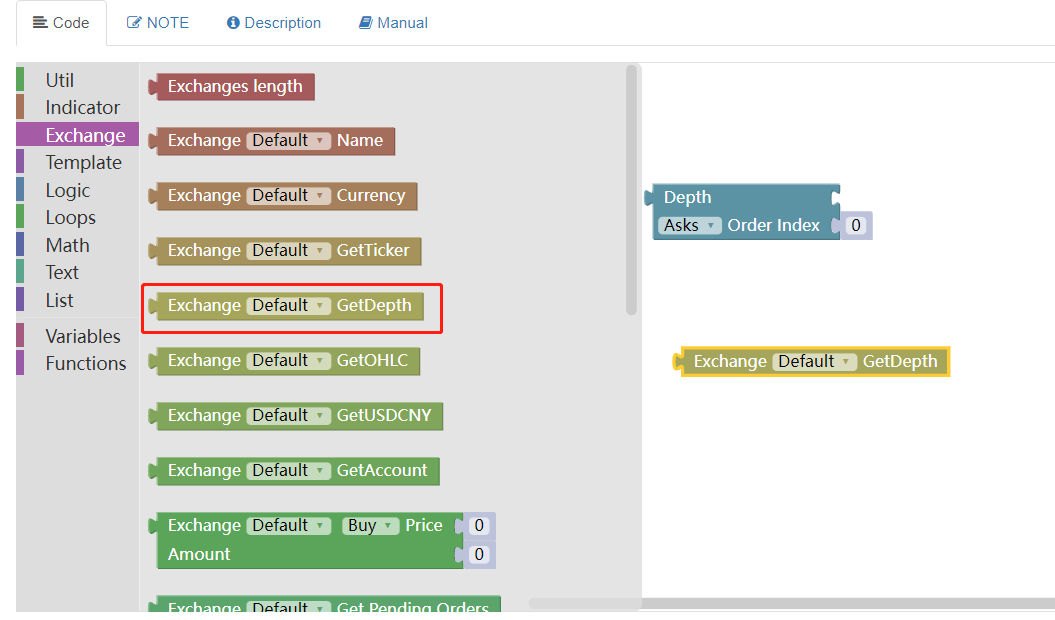
The index is set to 0 and the selling order is set to obtain the information of the selling one order.
Like JavaScript strategy code:
            function main () {
    Log(exchange.GetDepth().Asks[0])
}
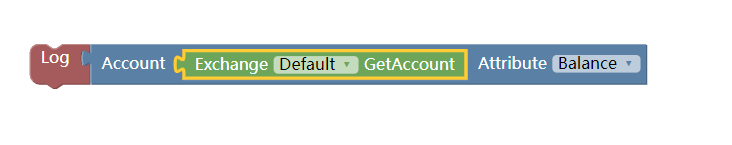
- Module for obtaining an attribute in asset information

This module needs to be used together with the module of obtaining asset information.
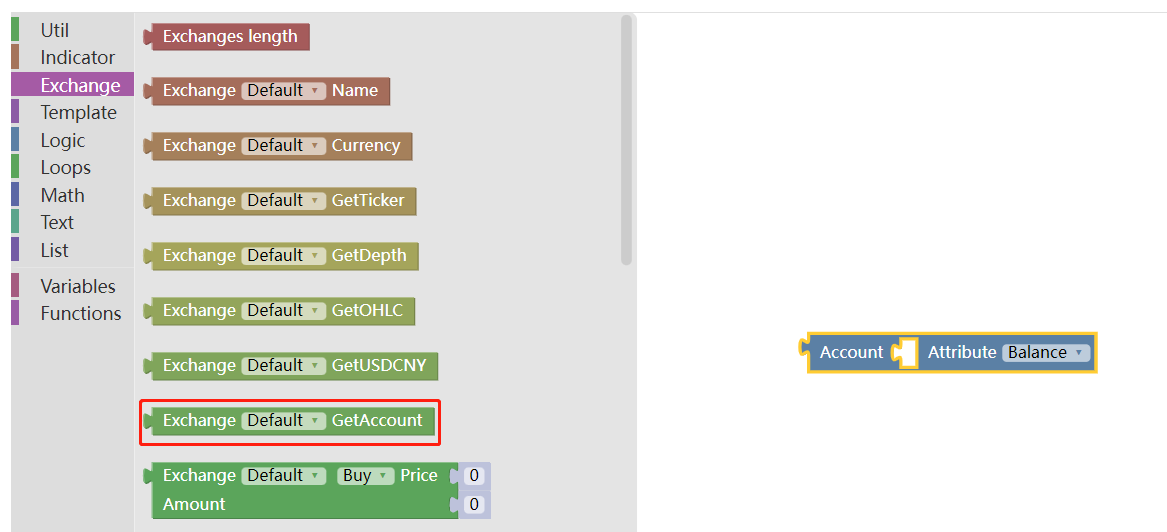
For example: print the available currency of the current account
Backtesting display:
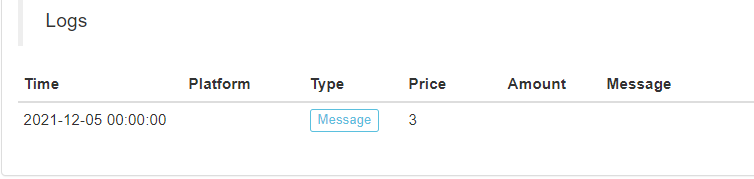
Like JavaScript strategy code:
            function main () {
    Log(exchange.GetAccount().Stocks)
}
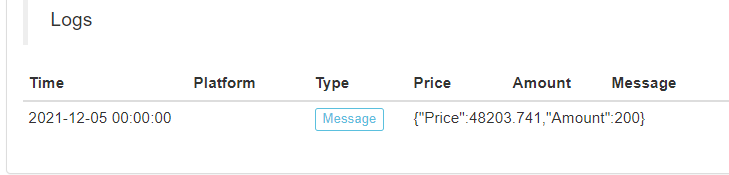
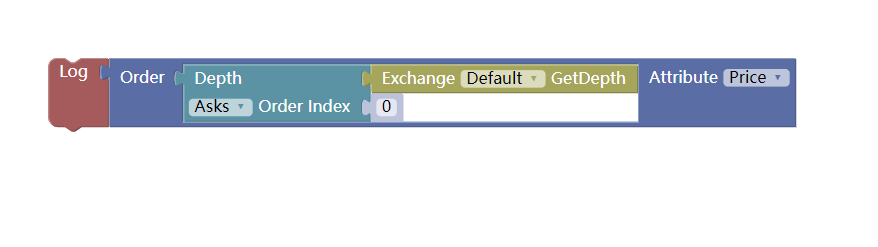
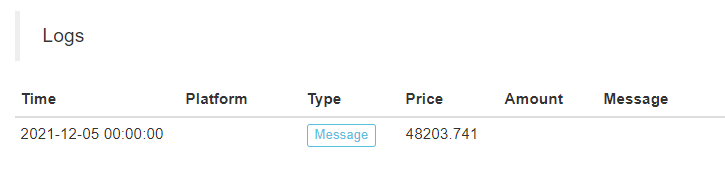
- Module for obtaining an attribute in order data
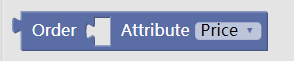
This module is used to obtain the value of an attribute in the order data, such as the price or quantity of selling one in the order book (example of No.13).
Backtesting results:
Like JavaScript strategy code:
            function main () {
    Log(exchange.GetDepth().Asks[0].Price)
}
It can also be used to obtain an attribute in the order information returned by the "Query Order Details Module" (to be explained in the advanced chapter).
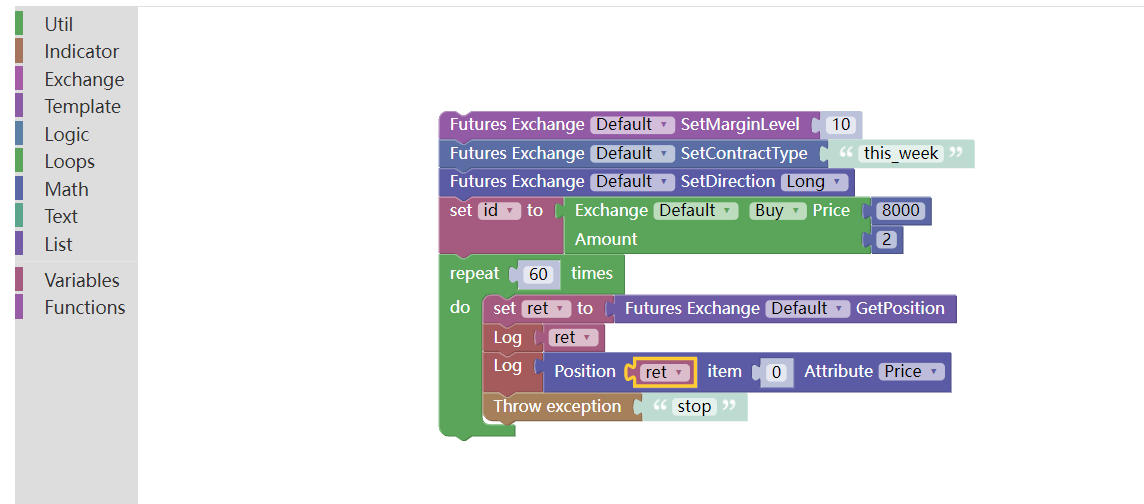
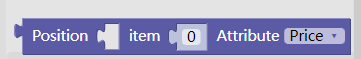
- The module to obtain the attributes of a position in the position information
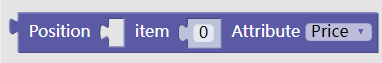
Similarly, it should be used together with the "Get Futures Position Module". Note that the position data returned by the "Get Futures Position Module" is an array (list) that contains positions in different contracts and directions. Therefore, the index should be specified when using.
Having learned so much, let's combine a hedging operation, that is, hedging both short-term and forward contracts.
We make a positive arbitrage hedge, that is, open a short position contract for the forward contract, and open a long position contract for the recent contract.
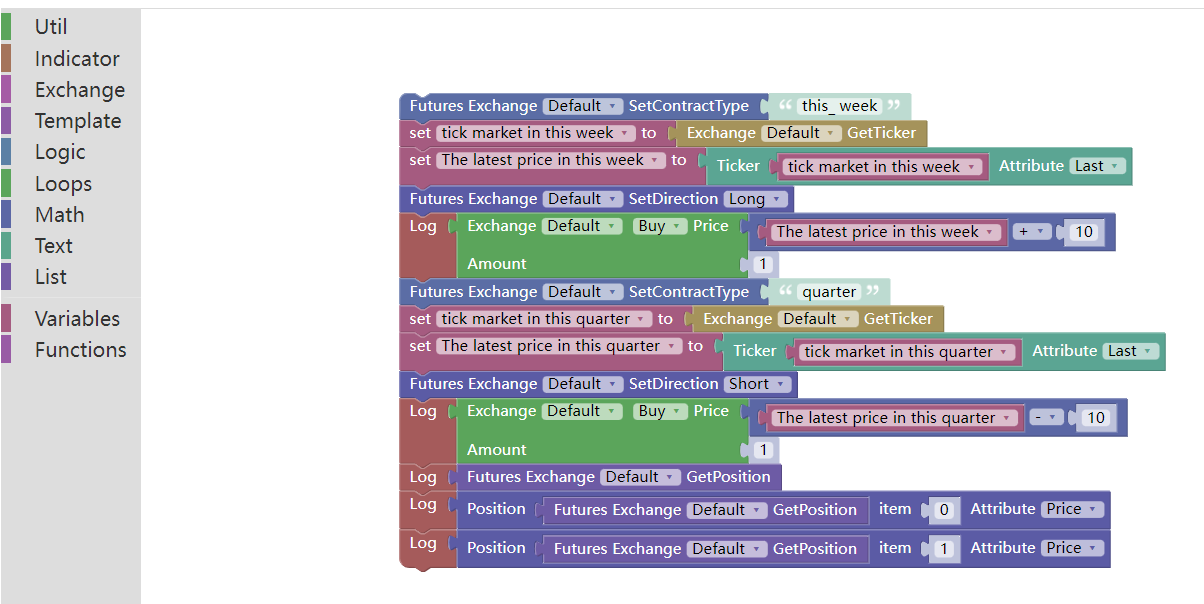
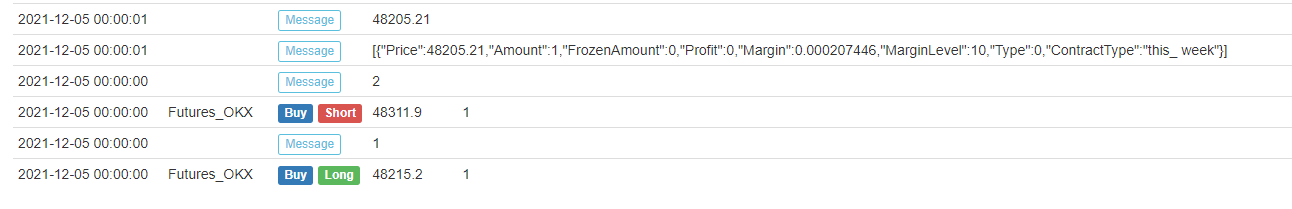
Backtesting results:
Examples of visualization strategies:
https://www.fmz.com/strategy/121404
https://www.fmz.com/strategy/129895
https://www.fmz.com/strategy/123904
https://www.fmz.com/strategy/122318
For more strategies, please refer to: https://www.fmz.com/square
Other articles in this series
-Visualization Module to Build Trading Strategies - In-depth (https://www.fmz.com/digest-topic/9509)
-Visualization Module to Build Trading Strategy - Advanced Understanding (https://www.fmz.com/bbs-topic/9815)
The boring programming can be easily completed by building blocks. It's very interesting to try!
- 1