
এই কৌশলটি মূলত তানজিং-আন-চ্যানেল-কুইন সূচকের মাধ্যমে ট্র্যাকিং-টাইপ ব্রেকিং ট্রেডিং কৌশলটি বাস্তবায়িত করে। এই কৌশলটি প্রবণতা এবং ব্রেকিং দুটি ট্রেডিং ধারণা একত্রিত করে, দীর্ঘ লাইন প্রবণতার বিচারের ভিত্তিতে, স্বল্প সময়ের ব্রেকিং পয়েন্টগুলি সন্ধান করে এবং প্রবণতার পরিস্থিতিতে সুষম ব্যবসায়ের জন্য। এছাড়াও, কৌশলটি প্রতিটি ব্যবসায়ের ঝুঁকি-লাভের অনুপাত নিয়ন্ত্রণের জন্য স্টপ লস এবং স্টপ লেভেল সেট করে। সামগ্রিকভাবে, এই কৌশলটির প্রবণতা অনুসরণ করার সুবিধা রয়েছে, যা দীর্ঘ লাইন প্রবণতার সুযোগগুলি ধরে রাখতে পারে।
প্যারামিটার সেট করুন, ডিফল্ট পিরিয়ড ২০;
EMA সমতল চলমান গড় রেখা, ডিফল্ট 200 চক্র;
ডিফল্ট রিস্ক-রিটার্ন অনুপাতঃ 1.5
প্যারামিটারগুলি ব্রেক-এন্ড-পিস করুন, যথাক্রমে মাল্টি-হেড এবং খালি হেড;
একটি ব্রেকআউট রেকর্ড করা হয়েছে কি না;
মাল্টি হেড সিগন্যালঃ যদি পূর্ববর্তী ব্রেকডাউনটি নিম্ন হয় এবং দামটি ডংকিয়াং উপরের রেলের উপরে এবং EMA গড়ের উপরে থাকে তবে একটি মাল্টি হেড সিগন্যাল তৈরি করুন;
খালি মাথা সংকেত: যদি পূর্ববর্তী ব্রেকডাউনটি একটি উচ্চ পয়েন্ট হয় এবং দামটি ডনজিনের নীচের ট্র্যাকের নীচে এবং ইএমএর গড়ের নীচে থাকে তবে খালি মাথা সংকেত উত্পন্ন হয়;
একাধিক পজিশনে প্রবেশের পরে, স্টপ লসটি দংচিয়ান ট্র্যাকের নীচে 5 পয়েন্ট প্রত্যাহারের জন্য সেট করুন, স্টপ লসটি ঝুঁকি-লাভের অনুপাতের চেয়ে স্টপ লস দূরত্বের গুণিতক;
খালি পজিশনে প্রবেশের পরে, স্টপ লসটি ডং চিয়ান রেলের উপরে 5 পয়েন্ট প্রত্যাহারের জন্য সেট করুন এবং স্টপ লসটি ঝুঁকি-লাভের অনুপাতের চেয়ে স্টপ লস দূরত্বের চেয়ে বেশি।
এই পদ্ধতিতে, কৌশলটি প্রবণতা বিচার এবং বিরতি অপারেশনগুলির সাথে মিলিত হয়, যা দীর্ঘ লাইন প্রবণতার মধ্যে স্বল্প সময়ের সুযোগগুলি ক্যাপচার করতে পারে। একই সময়ে, স্টপ লস স্টপ সেটিংটি একক ব্যবসায়ের ঝুঁকি-লাভের পরিস্থিতি নিয়ন্ত্রণ করতে পারে।
দীর্ঘ লাইন ট্রেন্ড অনুসরণ করুন, চলতে থাকুন এবং বিপরীত ট্রেডিং এড়িয়ে চলুন।
ডং চিয়ান চ্যানেল একটি দীর্ঘ লাইন সূচক, যা EMA সমান্তরাল ফিল্টার সহ প্রবণতা দিকটি আরও ভালভাবে নির্ধারণ করতে পারে।
ক্ষতি প্রতিরোধ ব্যবস্থা প্রতিটি ঝুঁকি নিয়ন্ত্রণ করে এবং সম্ভাব্য ক্ষতি সীমাবদ্ধ করে।
ঝুঁকি-লাভের অনুপাত অনুকূলিতকরণ, ক্ষতি-ক্ষতির অনুপাত বাড়ানো, অতিরিক্ত লাভের চেষ্টা করা।
ফিডব্যাক প্যারামিটার সেটিং নমনীয়, যা বিভিন্ন বাজারের জন্য সর্বোত্তম প্যারামিটার সমন্বয় করতে পারে।
ডং চিয়াং চ্যানেল এবং ইএমএ সমান্তরাল ফিল্টারিং সূচক হিসাবে ব্যবহৃত হয়, যা ভুল সংকেত দিতে পারে।
ট্রেন্ডিংয়ের ক্ষেত্রে, ট্রেন্ডিংয়ের পটভূমিকে চিহ্নিত করার জন্য, ট্রেন্ডিংয়ের পটভূমিকে চিহ্নিত করার জন্য, ট্রেন্ডিংয়ের পটভূমিকে চিহ্নিত করা প্রয়োজন।
স্টপ লস স্টপ দুরত্বটি স্থির করা হয়েছে এবং বাজারের অস্থিরতার সাথে সামঞ্জস্য করা যায় না।
প্যারামিটারগুলি অপ্টিমাইজ করার জন্য সীমিত স্থান রয়েছে এবং রিয়েল-ডিস্কের কার্যকারিতা নিশ্চিত করা কঠিন।
ব্ল্যাক সোয়ান ইভেন্টের ফলে যেহেতু ট্রেডিং সিস্টেমটি খুব বেশি র্যান্ডম ইভেন্টের পরীক্ষা নিতে পারে না, তাই এটি বড় ক্ষতির কারণ হতে পারে।
সিগন্যালের গুণগত মান উন্নত করার জন্য আরও কিছু সূচক যুক্ত করার কথা বিবেচনা করা যেতে পারে, যেমন কম্পন সূচক।
স্মার্ট স্টপ লস স্টপ সেট করা যায়, বাজারের ওঠানামা এবং এটিআর সূচকের গতিশীলতার উপর ভিত্তি করে লস পজিশনের সমন্বয় করা যায়।
মেশিন লার্নিং এবং অন্যান্য পদ্ধতি ব্যবহার করে পরামিতিগুলি পরীক্ষা এবং অপ্টিমাইজ করা যেতে পারে, যাতে এটি বাস্তব বাজারের আরও কাছাকাছি হয়।
ভলিউম বা ভোল্টেবল রেট সূচকগুলিকে একটি সহায়ক শর্ত হিসাবে সেট করে প্রবেশের লজিকটি অনুকূলিতকরণ করা যেতে পারে এবং ফাঁদ এড়ানো যায়।
ট্রেন্ড ট্র্যাকিং কৌশল বা মেশিন লার্নিং এর সাথে মিশ্রিত কৌশলগুলি বিবেচনা করা যেতে পারে, যা স্থিতিশীলতা বাড়াতে পারে।
এই কৌশলটি একটি ট্র্যাকিং-টাইপ ব্রেকিং কৌশল হিসাবে, মূল ধারণাটি দীর্ঘ লাইনের প্রবণতা নির্ধারণের উপর ভিত্তি করে, সংকেত হিসাবে ব্রেকিংয়ের জন্য চলমান অপারেশন এবং একক লেনদেনের ঝুঁকি নিয়ন্ত্রণের জন্য স্টপ লস স্টপ সেট করা। এই কৌশলটির কিছু সুবিধা রয়েছে, তবে কিছু অপ্টিমাইজ করার জায়গাও রয়েছে। সামগ্রিকভাবে, যদি আপনি প্যারামিটার সেটিং, প্রবেশের সময় নির্বাচন এবং অন্যান্য প্রযুক্তির সাথে সংযুক্ত হন তবে এই কৌশলটি একটি কার্যকর প্রবণতা ট্র্যাকিং কৌশল হতে পারে। তবে বিনিয়োগকারীদের এখনও মনে রাখা উচিত যে কোনও ট্রেডিং সিস্টেম বাজারের ঝুঁকিকে পুরোপুরি এড়াতে পারে না, ভাল ঝুঁকি পরিচালনার প্রয়োজন।
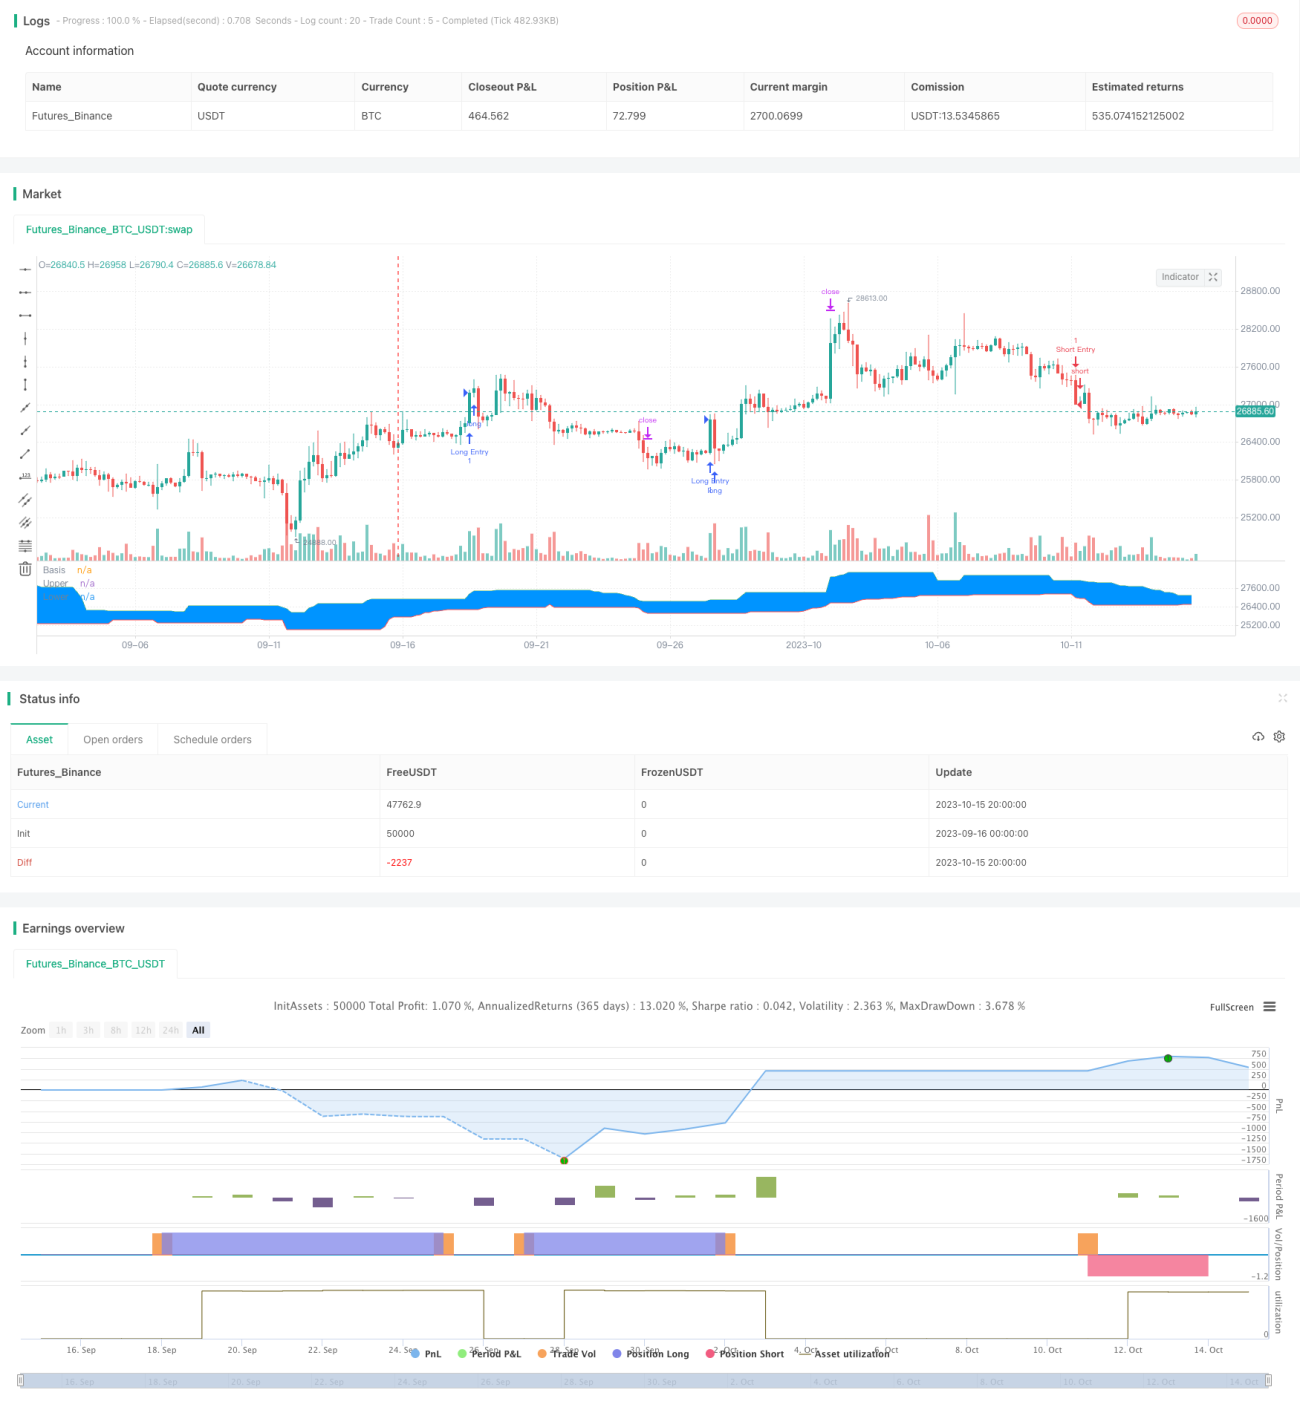
/*backtest
start: 2023-09-16 00:00:00
end: 2023-10-16 00:00:00
period: 4h
basePeriod: 15m
exchanges: [{"eid":"Futures_Binance","currency":"BTC_USDT"}]
*/
//@version=4
// Welcome to my second script on Tradingview with Pinescript
// First of, I'm sorry for the amount of comments on this script, this script was a challenge for me, fun one for sure, but I wanted to thoroughly go through every step before making the script public
// Glad I did so because I fixed some weird things and I ended up forgetting to add the EMA into the equation so our entry signals were a mess
// This one was a lot tougher to complete compared to my MACD crossover trend strategy but I learned a ton from it, which is always good and fun
// Also I'll explain the strategy and how I got there through some creative coding(I'm saying creative because I had to figure this stuff out by myself as I couldn't find any reference codes)
// First things first. This is a Donchian Channel Breakout strategy which follows the following rules
// If the price hits the upperband of the Donchian Channel + price is above EMA and the price previously hit the lowerband of the Donchian Channel it's a buy signal
// If the price hits the lowerband of the Donchian Channel + price is below EMA and the price prevbiously hit the upper band of the Donchian Channel it's a sell signal
// Stop losses are set at the lower or upper band with a 0.5% deviation because we are acting as if those two bands are the resistance in this case
// Last but not least(yes, this gave BY FAR the most trouble to code), the profit target is set with a 1.5 risk to reward ratio
// If you have any suggestions to make my code more efficient, I'll be happy to hear so from you
// So without further ado, let's walk through the code
// The first line is basically standard because it makes backtesting so much more easy, commission value is based on Binance futures fees when you're using BNB to pay those fees in the futures market
// strategy(title="Donchian Channels", shorttitle="DC", overlay=true, default_qty_type = strategy.cash, default_qty_value = 150, initial_capital = 1000, currency = currency.USD, commission_type = "percent", commission_value = 0.036)
// The built-in Donchian Channels + an added EMA input which I grouped with the historical bars from the Donchian Channels
length = input(20, minval=1, group = "Indicators")
lower = lowest(length)
upper = highest(length)
basis = avg(upper, lower)
emaInput = input(title = "EMA Input", type = input.integer, defval = 200, minval = 10, maxval = 400, step = 1, group = "Indicators")
// I've made three new inputs, for risk/reward ratio and for the standard pullback deviation. My advise is to not use the pullback inputs as I'm not 100% sure if they work as intended or not
riskreward = input(title = "Risk/Reward Ratio", type = input.float, defval = 1.50, minval = 0.01, maxval = 100, step = 0.01, group = "Risk/Reward")
pullbackLong = input(title = "Distance from Long pullback %", type = input.float, defval = 0.995, minval = 0.001, maxval = 2, step = 0.001, group = "Risk/Reward")
pullbackShort = input(title = "Distance from Short pullback %", type = input.float, defval = 1.005, minval = 0.001, maxval = 2, step = 0.001, group = "Risk/Reward")
// Input backtest range, you can adjust these in the input options, just standard stuff
fromMonth = input(defval = 1, title = "From Month", type = input.integer, minval = 1, maxval = 12, group = "Backtest Date Range")
fromDay = input(defval = 1, title = "From Day", type = input.integer, minval = 1, maxval = 31, group = "Backtest Date Range")
fromYear = input(defval = 2000, title = "From Year", type = input.integer, minval = 1970, group = "Backtest Date Range")
thruMonth = input(defval = 1, title = "Thru Month", type = input.integer, minval = 1, maxval = 12, group = "Backtest Date Range")
thruDay = input(defval = 1, title = "Thru Day", type = input.integer, minval = 1, maxval = 31, group = "Backtest Date Range")
thruYear = input(defval = 2099, title = "Thru Year", type = input.integer, minval = 1970, group = "Backtest Date Range")
// Date variable also standard stuff
inDataRange = (time >= timestamp(syminfo.timezone, fromYear, fromMonth, fromDay, 0, 0)) and (time < timestamp(syminfo.timezone, thruYear, thruMonth, thruDay, 0, 0))
// I had to makes these variables because the system has to remember whether the previous 'breakout' was a high or a low
// Also, because I based my stoploss on the upper/lower band of the indicator I had to find a way to change this value just once without losing the value, that was added, on the next bar
var previousishigh = false
var previousislow = false
var longprofit = 0.0
var shortprofit = 0.0
var stoplossLong = 0.0
var stoplossShort = 0.0
// These are used as our entry variables
emaCheck = ema(close, emaInput)
longcond = high >= upper and close > emaCheck
shortcond = low <= lower and close < emaCheck
// With these two if statements I'm changing the boolean variable above to true, we need this to decide out entry position
if high >= upper
previousishigh := true
if low <= lower
previousislow := true
// Made a last minute change on this part. To clean up our entry signals we don't want our breakouts, while IN a position, to change. This way we do not instantly open a new position, almost always in the opposite direction, upon exiting one
if strategy.position_size > 0 or strategy.position_size < 0
previousishigh := false
previousislow := false
// Strategy inputs
// Long - previous 'breakout' has to be a low, the current price has to be a new high and above the EMA, we're not allowed to be in a position and ofcourse it has to be within our given data for backtesting purposes
if previousislow == true and longcond and strategy.position_size == 0 and inDataRange
strategy.entry("Long Entry", strategy.long, comment = "Entry Long")
stoplossLong := lower * pullbackLong
longprofit := ((((1 - stoplossLong / close) * riskreward) + 1) * close)
strategy.exit("Long Exit", "Long Entry", limit = longprofit, stop = stoplossLong, comment = "Long Exit")
// Short - Previous 'breakout' has to be a high, current price has to be a new low and lowe than the 200EMA, we're not allowed to trade when we're in a position and it has to be within our given data for backtesting purposes
if previousishigh == true and shortcond and strategy.position_size == 0 and inDataRange
strategy.entry("Short Entry", strategy.short, comment = "Entry Short")
stoplossShort := upper * pullbackShort
shortprofit := (close - ((((1 - close / stoplossShort) * riskreward) * close)))
strategy.exit("Short Exit", "Short Entry", limit = shortprofit, stop = stoplossShort, comment = "Short Exit")
// This plots the Donchian Channels on the chart which is just using the built-in Donchian Channels
plot(basis, "Basis", color=color.blue)
u = plot(upper, "Upper", color=color.green)
l = plot(lower, "Lower", color=color.red)
fill(u, l, color=#0094FF, transp=95, title="Background")
// These plots are to show if the variables are working as intended, it's a mess I know but I didn't have any better ideas, they work well enough for me
// plot(previousislow ? close * 0.95 : na, color=color.red, linewidth=2, style=plot.style_linebr)
// plot(previousishigh ? close * 1.05 : na, color=color.green, style=plot.style_linebr)
// plot(longprofit, color=color.purple)
// plot(shortprofit, color=color.silver)
// plot(stoplossLong)
// plot(stoplossShort)
// plot(strategy.position_size)