লাইন ট্রেডিং কৌশল

ওভারভিউ
এই কৌশলটি মূল সমর্থন এবং প্রতিরোধের ভাঙ্গার উপর ভিত্তি করে, মূল্য চার্টগুলিতে মূল উত্থান এবং পতনের প্রবণতা লাইনগুলি সনাক্ত করে এবং যখন দামগুলি প্রবণতা লাইনটি ভেঙে দেয় তখন ট্রেড করে। কৌশলটি সহজ, নির্ভরযোগ্য এবং প্রবণতা-স্পষ্ট বাজারের পরিবেশের জন্য উপযুক্ত।
কৌশল নীতি
এই কৌশলটি বাম এবং ডান স্তম্ভের উচ্চ এবং নিম্ন পয়েন্টগুলি গণনা করে এবং দামের উত্থান এবং পতনের মূল পয়েন্টগুলি সনাক্ত করে, যার ফলে সমর্থন লাইন এবং চাপ লাইন পাওয়া যায়। বিশেষ করেঃ
-
ব্যবহার
pivothigh()এবংpivotlow()ফাংশনটি মূল উচ্চতা এবং নিম্নতা সনাক্ত করে। -
উচ্চ নিম্ন পয়েন্ট উপর ভিত্তি করে সমর্থন লাইন এবং চাপ লাইন অঙ্কন সমীকরণ <unk>
-
যখন দাম চাপের রেখা অতিক্রম করে, তখন বেশি করুন; যখন দাম সমর্থন রেখা অতিক্রম করে, তখন কম করুন।
-
প্রবণতা অনুসারে অতিরিক্ত বা কম কাজ করা।
-
আপনি একটি বিপর্যয়ের সময় সরাসরি প্যাসিং পরিবর্তন করতে পারেন কিনা তা নির্বাচন করুন।
-
স্টপ, স্টপ-অফ, স্টপ-অফ-টেইল অপশন আছে।
-
সুইং পয়েন্ট স্টপ, এটিআর স্টপ, ফিক্সড স্টপ।
এই কৌশলটি ট্রেডিংয়ের জন্য সহজ ট্রেন্ডিংয়ের মাধ্যমে ট্রেডিংয়ের মাধ্যমে ট্রেডিংয়ের মাধ্যমে ট্রেডিংয়ের মাধ্যমে ট্রেডিংয়ের মাধ্যমে ট্রেডিংয়ের মাধ্যমে ট্রেডিংয়ের মাধ্যমে ট্রেডিংয়ের মাধ্যমে ট্রেডিংয়ের মাধ্যমে ট্রেডিংয়ের মাধ্যমে ট্রেডিংয়ের মাধ্যমে ট্রেডিংয়ের মাধ্যমে ট্রেডিংয়ের মাধ্যমে ট্রেডিংয়ের মাধ্যমে ট্রেডিংয়ের মাধ্যমে ট্রেডিংয়ের মাধ্যমে ট্রেডিংয়ের মাধ্যমে ট্রেডিংয়ের মাধ্যমে ট্রেডিংয়ের মাধ্যমে ট্রেডিংয়ের মাধ্যমে ট্রেডিংয়ের মাধ্যমে ট্রেডিংয়ের মাধ্যমে ট্রেডিংয়ের মাধ্যমে ট্রেডিংয়ের মাধ্যমে ট্রেডিংয়ের মাধ্যমে ট্রেডিংয়ের মাধ্যমে ট্রেডিংয়ের মাধ্যমে ট্রেডিংয়ের মাধ্যমে ট্রেডিংয়ের মাধ্যমে ট্রেডিংয়ের মাধ্যমে ট্রেডিংয়ের মাধ্যমে ট্রেডিংয়ের মাধ্যমে ট্রেডিংয়ের মাধ্যমে ট্রেডিংয়ের মাধ্যমে ট্রেডিংয়ের মাধ্যমে ট্রেডিংয়ের মাধ্যমে ট্রেডিংয়ের মাধ্যমে ট্রেডিংয়ের মাধ্যমে ট্রেডিংয়ের মাধ্যমে ট্রেডিংয়ের মাধ্যমে ট্রেডিংয়ের মাধ্যমে ট্রেডিংয়ের মাধ্যমে ট্রেডিংয়ের মাধ্যমে ট্রেডিংয়ের মাধ্যমে ট্রেডিংয়ের মাধ্যমে ট্রেডিংয়ের মাধ্যমে ট্রেডিংয়ের মাধ্যমে ট্রেডিংয়ের মাধ্যমে ট্রেডিংয়ের মাধ্যমে ট্রে
সামর্থ্য বিশ্লেষণ
- এই কৌশলটি সহজ, সহজে বোঝা যায় এবং বাস্তবায়িত হয়।
- এই পদ্ধতিতে, আপনি একটি সম্ভাব্য সুবিধা পাবেন।
- স্টপ লস স্টপ সেট করুন, ঝুঁকি নিয়ন্ত্রণ করুন।
- ট্রেন্ড ট্র্যাকিং বা ট্রেন্ড রিভার্সনের জন্য উপলব্ধ।
- বিভিন্ন বাজারের পরিবেশের জন্য অপ্টিমাইজযোগ্য পরামিতি
ঝুঁকি বিশ্লেষণ
- এই ঘটনার পরে, সিগন্যালটি ভেঙে যায় এবং ভুলভাবে রিপোর্ট করা হতে পারে।
- ভুলভাবে স্টপ পয়েন্ট সেট করলে ক্ষতি বাড়তে পারে।
- বিপরীত দিকের অপারেশনে ফাঁকি দেওয়ার ঝুঁকি রয়েছে।
- প্যারামিটার টিউন করার জন্য অভিজ্ঞতা প্রয়োজন, এবং এটি ভুলভাবে সেট করা হলে এটি ব্যর্থ হতে পারে।
- এই প্রবণতা বিপর্যস্ত হওয়ার পরে, এই প্রবণতা বিপর্যস্ত হওয়ার পরেও চলতে থাকে।
ঝুঁকি কমানোর জন্য, স্টপ লস কৌশল অপ্টিমাইজ করা, ব্রেকিং সিগন্যালের গুণমান মূল্যায়ন করা, রিভার্সাল টাইমিংয়ের মূল্যায়ন করা ইত্যাদি পদ্ধতি ব্যবহার করা যেতে পারে।
অপ্টিমাইজেশান দিক
- এই নতুন প্রযুক্তির মাধ্যমে, সিগন্যালের নির্ভরযোগ্যতা মূল্যায়ন করা হবে এবং এর সঠিকতা বাড়ানো হবে।
- ভলিউম সংযুক্ত করুন, এবং আপনার সিগন্যালকে শক্তিশালী করুন।
- বাজারের অস্থিরতার সাথে সামঞ্জস্য রেখে ক্ষতি বন্ধের কৌশলগুলি অনুকূলিত করুন।
- "এখনই, আমি এই সিদ্ধান্তে পৌঁছেছি।
- parameter tuning。
- মাল্টি ফ্যাক্টর মডেলের মূল্যায়ন।
- মূল্যায়ন অন্যান্য সূচকগুলির সাথে একত্রিতভাবে ব্যবহৃত হয়।
সারসংক্ষেপ
এই কৌশলটি সামগ্রিকভাবে সহজ এবং ব্যবহারিক, সহজ প্রবণতা বিরতি দ্বারা মূল্য প্রবণতা, নিয়ন্ত্রণযোগ্য ঝুঁকি ক্যাপচার। কৌশলটি একাধিক দিকের মাধ্যমে অপ্টিমাইজ করা যেতে পারে, আরও বাজারের পরিস্থিতিতে প্রযোজ্য, সামগ্রিকভাবে একটি খুব ব্যবহারিক প্রবণতা ট্র্যাকিং কৌশল।
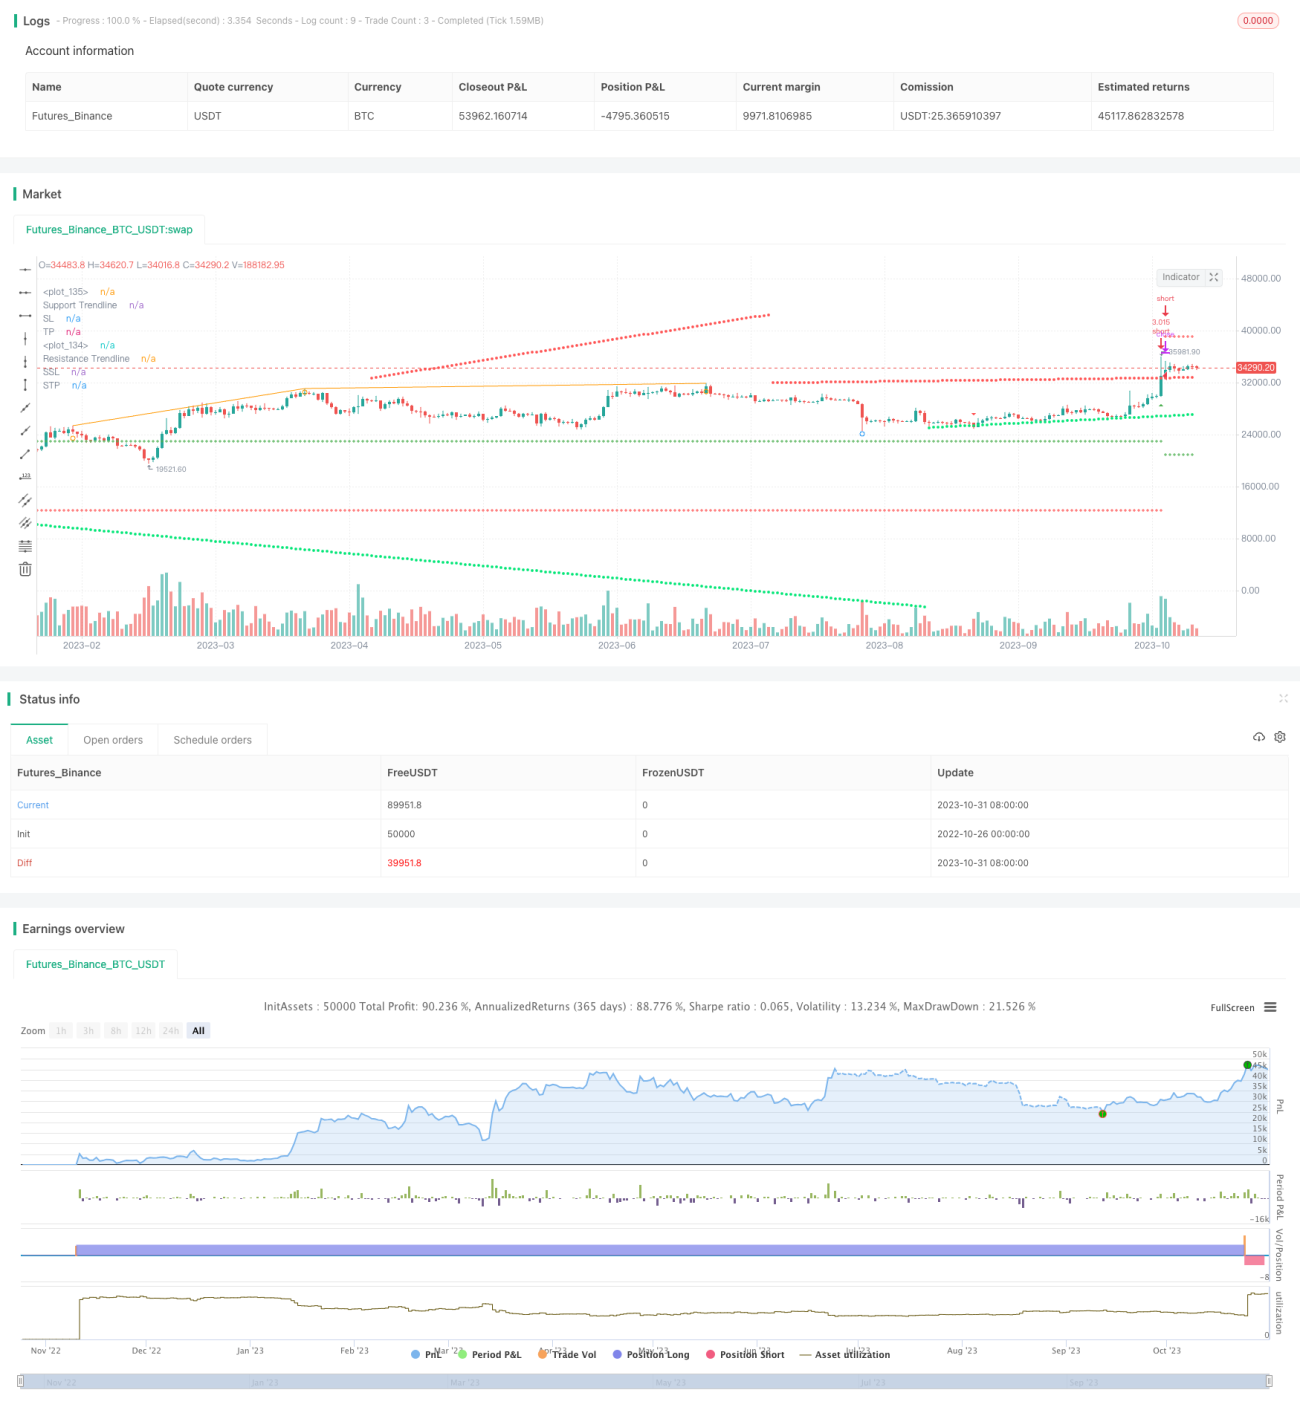
/*backtest
start: 2022-10-26 00:00:00
end: 2023-11-01 00:00:00
period: 1d
basePeriod: 1h
exchanges: [{"eid":"Futures_Binance","currency":"BTC_USDT"}]
*/

// This source code is subject to the terms of the Mozilla Public License 2.0 at https://mozilla.org/MPL/2.0/
// © tweakerID and © BacktestRookies

// Using the clever calculations and code by BacktestRookies, here is a strategy that buys - 1