মোমেন্টাম ব্রেকআউট ট্রেন্ড অনুসরণ কৌশল

ওভারভিউ
এই কৌশলটি প্রবণতার দিকনির্দেশনা সনাক্ত করার জন্য বিভিন্ন প্রযুক্তিগত সূচক ব্যবহার করে, যখন প্রবণতা গতিবেগ অতিক্রম করে তখন তা অনুসরণ করে এবং অতিরিক্ত মুনাফা অর্জনের চেষ্টা করে।
কৌশল নীতি
-
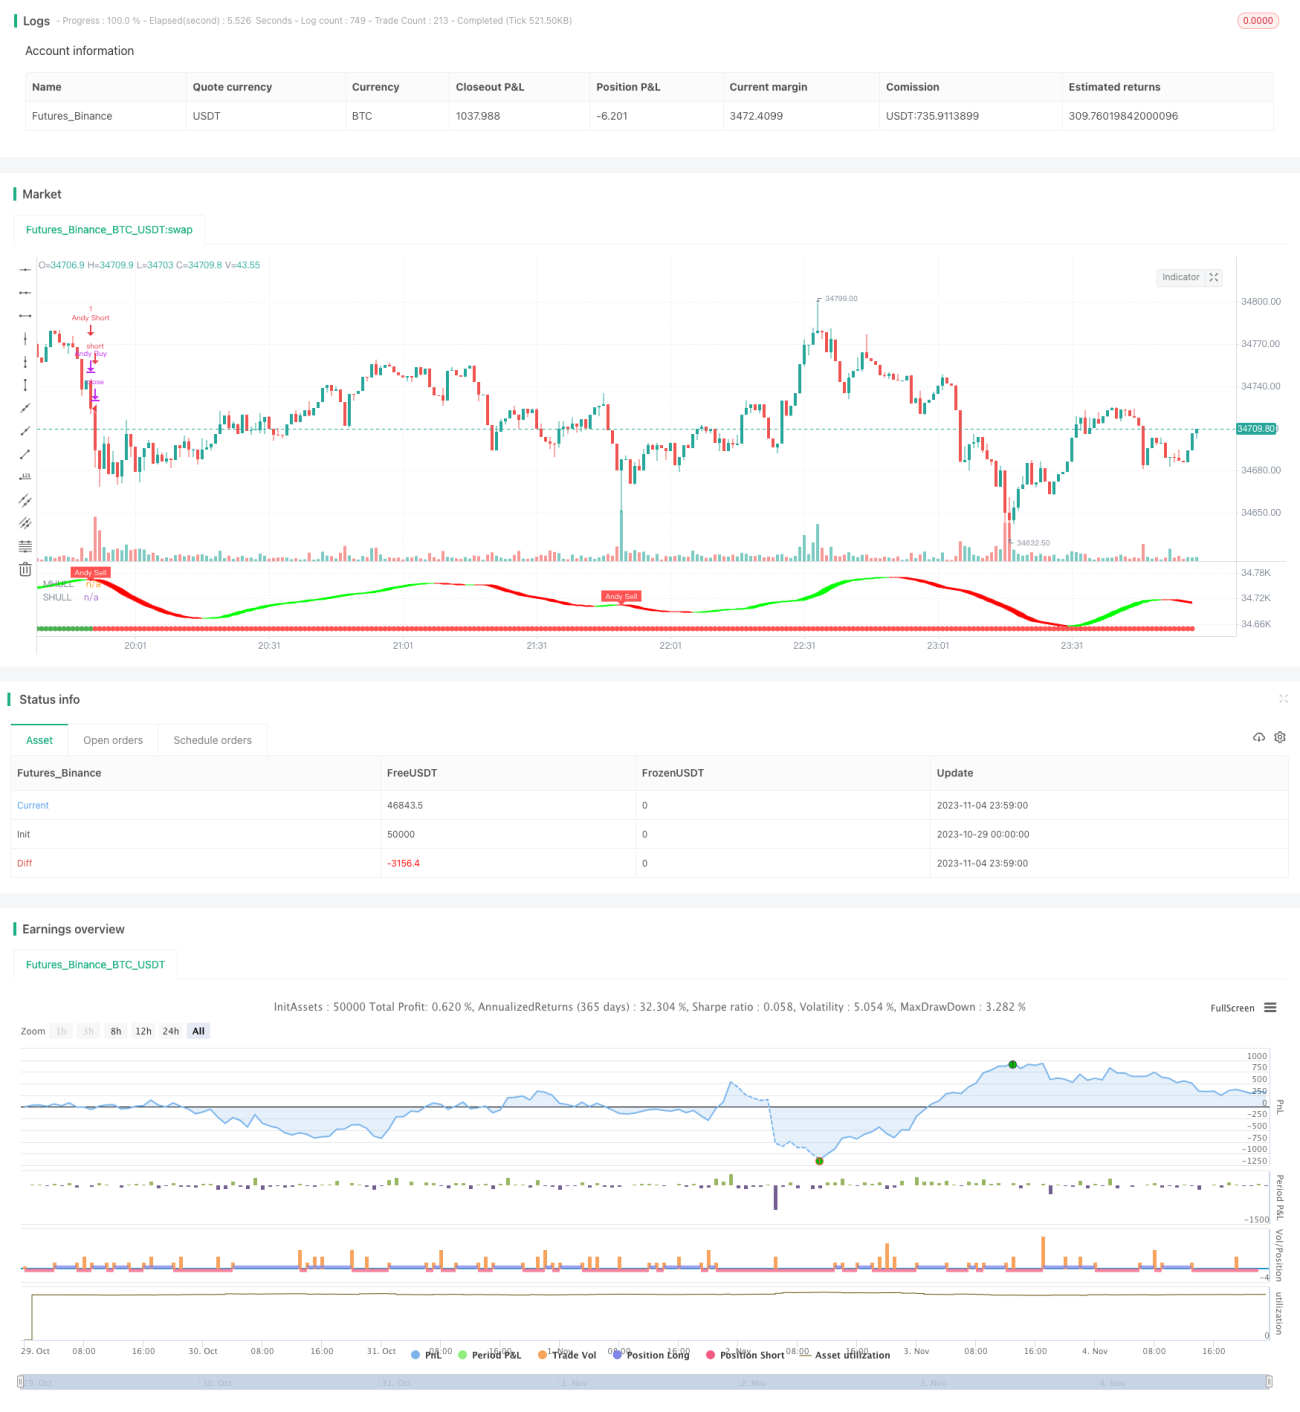
ডোনচিয়ান চ্যানেল ব্যবহার করে সামগ্রিক প্রবণতার দিকনির্দেশনা নির্ধারণ করুন। যখন দাম এই চ্যানেলটি ভেঙে দেয়, তখন নিশ্চিত করুন যে প্রবণতাটি পরিবর্তিত হয়েছে।
-
Hull Moving Average ট্রেন্ডের দিকনির্দেশনা নির্ধারণে সাহায্য করে। এই সূচকটি মূল্য পরিবর্তনের প্রতি সংবেদনশীল, যা প্রবণতা ঘুরিয়ে দেওয়ার আগে সনাক্ত করতে পারে।
-
অর্ধ-অর্বিটাল সিস্টেমটি ক্রয় এবং বিক্রয় সংকেত দেয়। এই সিস্টেমটি মূল্যের চ্যানেল এবং গড় সত্যিকারের ওঠানামা পরিসরের উপর ভিত্তি করে, যা মিথ্যা ভাঙ্গন এড়াতে পারে।
-
যখন ডোনচিয়ান চ্যানেল, হুল ইন্ডিকেটর এবং অর্ধ-অর্বিট সিস্টেম একসাথে সংকেত দেয়, তখন ট্রেন্ডটি শক্তিশালী গতির ব্রেকডাউন হিসাবে বিবেচিত হয়, এবং এই মুহুর্তে মাঠে প্রবেশ করে।
-
সমতল অবস্থার শর্তঃ যখন উপরের সূচকগুলি বিপরীত সংকেত দেয়, তখন ট্রেন্ডের বিপরীত সিদ্ধান্ত নেওয়া হয় এবং অবিলম্বে ক্ষতি বন্ধ করে দেওয়া হয়।
সামর্থ্য বিশ্লেষণ
-
একাধিক সূচক সমন্বয়, আরও ভাল বিচার. Donchian চ্যানেল মূলসূত্র নির্ধারণ, হাল সূচক এবং অর্ধ-অর্বিট বিশদ নির্ধারণ, প্রবণতা সুনির্দিষ্ট বাঁক পয়েন্ট বুঝতে।
-
প্রবণতা ব্রেক-ইন অংশগ্রহণ, অতিরিক্ত লাভের জন্য অনুসন্ধান করুন। প্রবণতাটি শক্তিশালী হওয়ার পরে কেবল প্রবেশ করুন, ঝড়ের মধ্যে আটকে না পড়ে।
-
কঠোর ক্ষতি বন্ধ করুন, তহবিল সুরক্ষা নিশ্চিত করুন। সূচকটি বিপরীত সংকেত দিলে অবিলম্বে ক্ষতি বন্ধ করুন, ক্ষতির বিস্তার এড়াতে।
-
প্যারামিটারগুলি নমনীয়ভাবে সামঞ্জস্য করা যায়, বিভিন্ন ধরণের বাজারের জন্য উপযুক্ত। বিভিন্ন চক্রের জন্য অনুকূলিতকরণের জন্য চ্যানেলের দৈর্ঘ্য, ওঠানামা ব্যাপ্তি ইত্যাদি প্যারামিটারগুলি সামঞ্জস্য করা যায়।
-
সহজেই বোঝা এবং বাস্তবায়ন করা যায়, এমনকি নতুনদের দ্বারাও পরিচালিত হতে পারে। নির্দেশক এবং শর্তাবলীর সংমিশ্রণটি সহজ এবং সহজেই প্রোগ্রাম করা যায়।
ঝুঁকি বিশ্লেষণ
-
ট্রেন্ডের শুরুতে সুযোগ মিস করা। ট্রেন্ডে প্রবেশের সময় দেরী হয়ে যায় এবং প্রাথমিক উত্থান ধরা যায় না।
-
বিপর্যয় বিপর্যয় বিপর্যয় বিপর্যয় বিপর্যয় বিপর্যয় বিপর্যয় বিপর্যয় বিপর্যয় বিপর্যয় বিপর্যয় বিপর্যয় বিপর্যয়
-
সূচকটি একটি ভুল সংকেত প্রেরণ করে। কারণ প্যারামিটারগুলি ভুলভাবে সেট করা হয়েছে, সূচকটি ভুলভাবে বিচার করা যেতে পারে।
-
ট্রেডিংয়ের সংখ্যা সীমিত। ট্রেডিংয়ের সংখ্যা সীমিত। ট্রেডিংয়ের সংখ্যা সীমিত।
অপ্টিমাইজেশান দিক
-
প্যারামিটার সমন্বয় অপ্টিমাইজ করুন. বিভিন্ন প্যারামিটার পরীক্ষা করে সেরা সমন্বয় খুঁজে বের করুন।
-
স্টপ লিনিয়ার রিট্র্যাক শর্ত যুক্ত করুন। প্রবণতার সুযোগ মিস করা এবং খুব তাড়াতাড়ি স্টপ এড়ানো।
-
অন্যান্য সূচক ফিল্টার যুক্ত করুন। যেমন MACD, KDJ ইত্যাদি সহায়ক বিচার, ত্রুটিযুক্ত সংকেত হ্রাস করুন।
-
ট্রেডিং সময়সীমা অপ্টিমাইজ করুন। বিভিন্ন সময়সীমার পরামিতি অপ্টিমাইজ করা যেতে পারে।
-
তহবিলের ব্যবহারের দক্ষতা বাড়ান। লিভারেজ, ফিক্সড ইনভেস্টমেন্ট ইত্যাদির মাধ্যমে তহবিলের ব্যবহারের দক্ষতা বাড়ান।
সারসংক্ষেপ
এই কৌশলটি একাধিক সূচককে সংহত করে যখন প্রবণতাটি গতিশীল হয়, তখন প্রবণতাটি অনুসরণ করে অতিরিক্ত উপার্জন অর্জন করা যায়। কঠোর স্টপ লস ম্যানেজমেন্ট ঝুঁকি নিয়ন্ত্রণ করে, নমনীয় পরামিতিগুলি বিভিন্ন বাজার পরিবেশের সাথে খাপ খাইয়ে নেয়। যদিও লেনদেনের ফ্রিকোয়েন্সি কম, তবে প্রতিটি লেনদেনের উচ্চ রিটার্ন পাওয়ার চেষ্টা করে। প্যারামিটার অপ্টিমাইজেশন, সহায়ক সূচক প্রবর্তন ইত্যাদির মাধ্যমে এই কৌশলটি ক্রমাগত উন্নতি করতে পারে।
- 1