উড়ন্ত ড্রাগন ট্রেন্ড কৌশল


সৃষ্টির তারিখ: 2023-11-07 14:57:23 অবশেষে সংশোধন করুন: 2023-11-07 14:57:23
অনুলিপি: 0 ক্লিকের সংখ্যা: 845
1
ফোকাস
1617
অনুসারী

উড়ন্ত ড্রাগন ট্রেন্ড কৌশল

ওভারভিউ

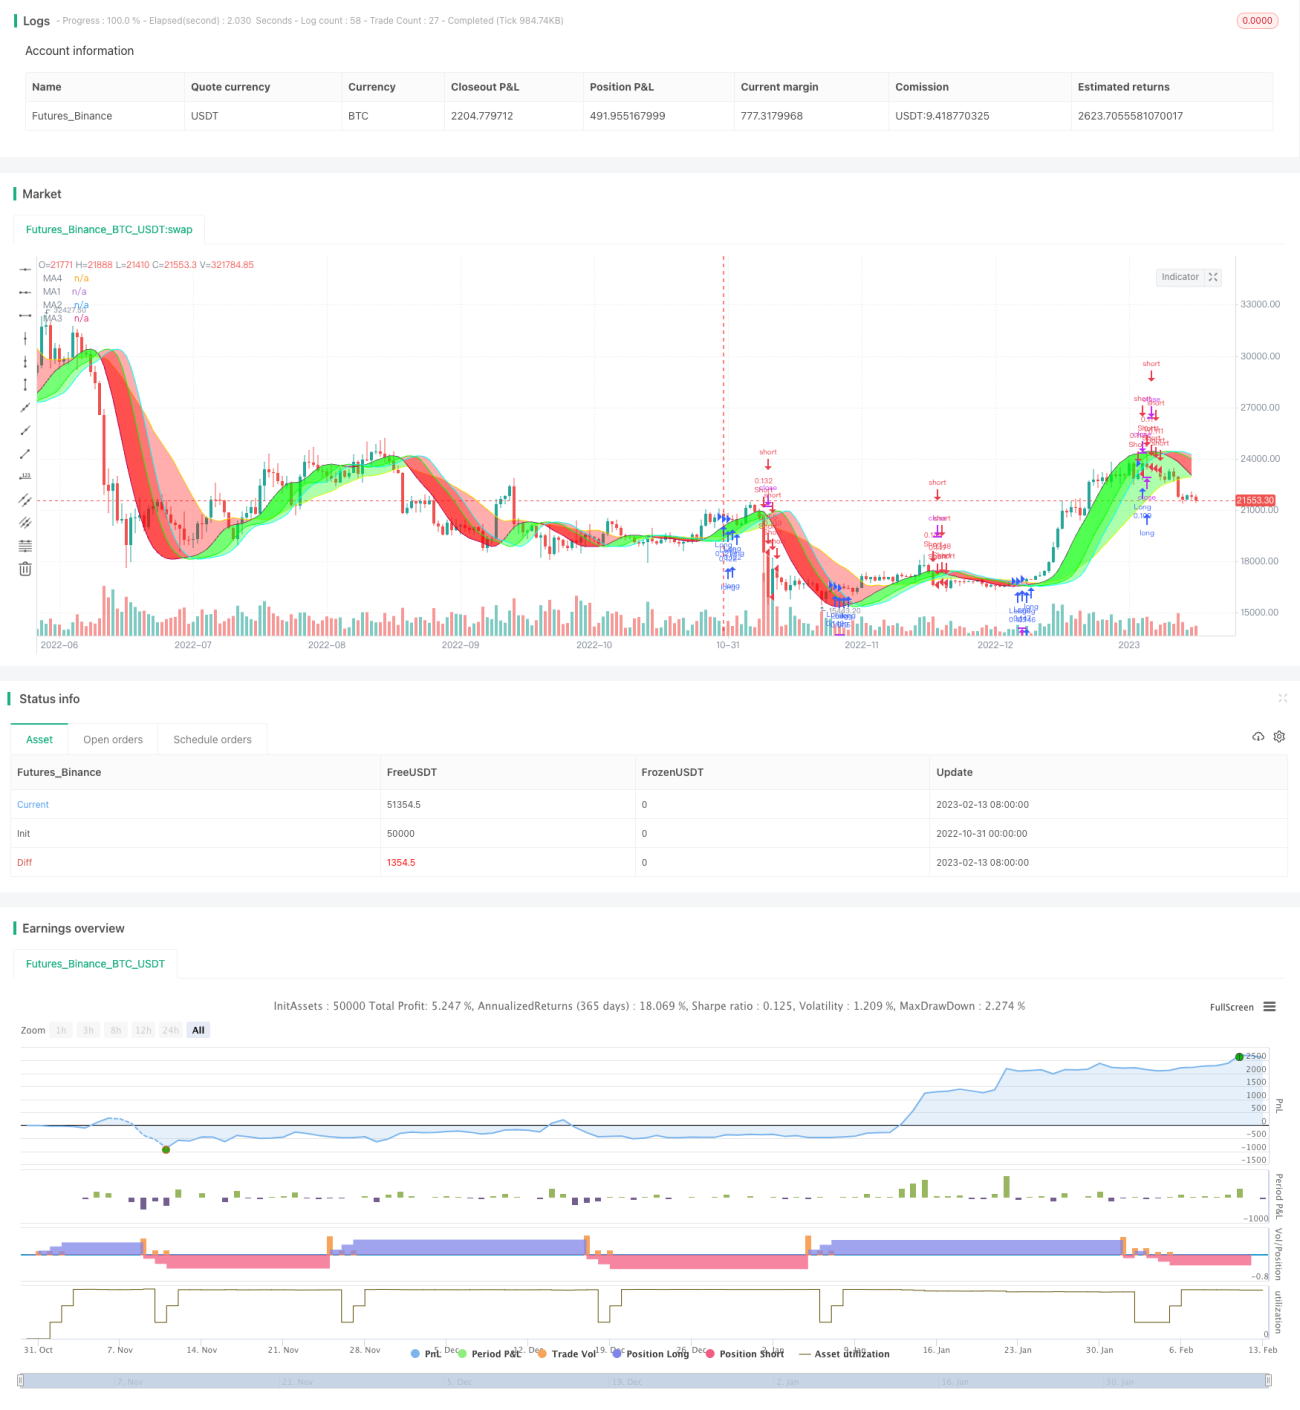
ফায়ারলং ট্রেন্ডিং কৌশলটি প্রবণতা বিচার এবং ট্রেডিং সংকেত উত্পন্ন করার জন্য বিভিন্ন রঙের প্রবণতা ব্যান্ডগুলি আঁকতে, চলমান গড়ের ধরণ, দৈর্ঘ্য এবং বিচ্যুতির পরিমাণকে সামঞ্জস্য করে। এই কৌশলটি বিভিন্ন সময়কালের মধ্যে সর্বোত্তম প্যারামিটার সমন্বয় খুঁজে পেতে পারে, যা প্রবণতা বিচার সঠিকতা এবং ট্রেডিং ঝুঁকিগুলির মধ্যে ভারসাম্য বজায় রাখে।

কৌশল নীতি

এই কৌশলটি MA1 এবং MA4 নামক দুটি মুভিং এভারেজ ব্যবহার করে ট্রেন্ড ব্রেন্ড আঁকতে ব্যবহৃত হয়। MA1 হল দ্রুতগতির মুভিং এভারেজ এবং MA4 হল ধীরগতির মুভিং এভারেজ। একই সময়ে, MA1 3 টি ওফসেট সেট করে (অফসেট 1, অফসেট 2, অফসেট 3) MA2 এবং MA3 গঠন করে। যখন দামের লাইনগুলি বিভিন্ন মুভিং এভারেজ অতিক্রম করে, তখন বিভিন্ন স্তরের ট্রেডিং সংকেত তৈরি হয়।

ব্যবহারকারীরা পাঁচটি ঝুঁকি স্তর বেছে নিতে পারেন, বিভিন্ন ঝুঁকি স্তরের অধীনে, বিভিন্ন মুভিং এভারেজ অতিক্রম করে ট্রেডিং সংকেত তৈরি করা হয়, ঝুঁকিগুলি উচ্চ থেকে নিম্নের মধ্যে রয়েছেঃ এমএ 1 অফসেট 1, এমএ 2, এমএ 3, এমএ 4, সমস্ত প্রবণতা বারের রঙ একই রকম। প্রবণতা বারের রঙটি বর্তমান প্রবণতার দিক নির্দেশ করে, সবুজটি উত্থান প্রবণতা, লালটি হ্রাস প্রবণতা।

এছাড়াও, এই কৌশলটি স্টপ লস ব্যবহারের অনুমতি দেয় এবং দীর্ঘ, সংক্ষিপ্ত বা দ্বি-মুখী ট্রেডিংয়ের বিকল্প দেয়।

সামর্থ্য বিশ্লেষণ

  • বিভিন্ন সময়কালের মধ্যে সর্বোত্তম প্যারামিটার সমন্বয় খুঁজে পাওয়া যায়, যা বিস্তৃত বাজার পরিবেশে উপযুক্ত
  • বিভিন্ন বৈচিত্র্যের জন্য অপ্টিমাইজ করা যেতে পারে যে বিভিন্ন অপ্টিমাইজযোগ্য চলন্ত গড় ধরনের উপলব্ধ
  • এই কৌশলটির কেন্দ্রবিন্দুতে রয়েছে সামঞ্জস্যযোগ্য বিচ্যুতি, যা প্রবণতাকে আরও সঠিক করে তোলে
  • ঝুঁকি এবং রিটার্নের মধ্যে একটি ভারসাম্য খুঁজে বের করার জন্য ঝুঁকি স্তর নির্বাচন করুন
  • একাধিক প্যারামিটারগুলি নমনীয়ভাবে একত্রিত করা যায়, অপ্টিমাইজেশনের জন্য আরও জায়গা রয়েছে
  • স্বজ্ঞাত প্রবণতা বন্ড, স্পষ্ট ভিজ্যুয়াল ট্রেডিং সিগন্যাল গঠন করে
  • ঝুঁকি নিয়ন্ত্রণের জন্য ক্ষতি প্রতিরোধক সমর্থন

ঝুঁকি বিশ্লেষণ

  • একটি উচ্চ ঝুঁকি গ্রেডের অধীনে, ভুল সংকেত উত্পন্ন করা সহজ, ঝুঁকি গ্রেড কমিয়ে বা প্যারামিটারগুলি সামঞ্জস্য করা উচিত
  • প্রবণতা বিপরীত হলে, ক্রমাগত ক্ষতিগ্রস্ত হওয়ার ঝুঁকি থাকতে পারে
  • বিভিন্ন জাতের জন্য আলাদা আলাদা পরামিতি পরীক্ষা এবং অপ্টিমাইজ করা প্রয়োজন, একই পরামিতি সব ক্ষেত্রে প্রযোজ্য নয়
  • উচ্চ ফ্রিকোয়েন্সি ট্রেডিংয়ের জন্য, আপনাকে দ্রুত চলমান গড়ের সাথে ধীর চলমান গড়ের সাথে সামঞ্জস্য করতে হবে
  • অপ্রয়োজনীয় প্যারামিটার অপ্টিমাইজেশনের ফলে অত্যধিক সংবেদনশীলতা বা অলসতা দেখা দিতে পারে, যার জন্য একাধিকবার পরীক্ষা করা প্রয়োজন

ঝুঁকি কমানোর জন্য ধাপে ধাপে ঝুঁকি কমানো, প্যারামিটার সমন্বয় পরীক্ষা বাড়ানো এবং বিভিন্ন জাতের জন্য পৃথক পৃথক প্যারামিটার অপ্টিমাইজ করা যেতে পারে।

অপ্টিমাইজেশান দিক

  • বিভিন্ন ধরনের চলমান গড় সমন্বয় চেষ্টা করুন
  • আরও দৈর্ঘ্য পরামিতি পরীক্ষা করে সেরা দৈর্ঘ্য খুঁজুন
  • আপনি যদি আপনার ডিভাইসটি পুনরায় ইনস্টল করতে চান তবে এটির জন্য একটি ভাল বিকল্প রয়েছে।
  • বিভিন্ন জাতের জন্য অনুকূলিতকরণ প্যারামিটার
  • স্টপ লস পয়েন্ট অপ্টিমাইজ করুন এবং স্টপ বন্ধ করার প্রয়োজন কিনা তা বিবেচনা করুন
  • বিভিন্ন পজিশনের নিয়ম চেষ্টা করুন
  • ফিল্টার অপ্টিমাইজেশান প্রয়োজন কিনা তা মূল্যায়ন করা
  • ট্রেন্ড স্ট্রেনথ ইন্ডিকেটর ইত্যাদি যোগ করার কথা ভাবুন

সারসংক্ষেপ

ফাইরং ট্রেন্ড কৌশলটি একটি কল্পনাপ্রসূত ট্রেডিং সিস্টেম ডিজাইন করেছে যা চলমান গড়ের একটি চতুর সংমিশ্রণ দ্বারা তৈরি করা হয়েছে। এই কৌশলটি প্যারামিটারগুলিকে সামঞ্জস্যপূর্ণ করে তোলে, বিভিন্ন জাতের বাজার পরিবেশের জন্য নিখুঁতভাবে অনুকূলিতকরণ করতে পারে, স্থিতিশীলতা এবং সংবেদনশীলতার মধ্যে সর্বোত্তম ভারসাম্য খুঁজে পেতে পারে। একাধিক প্যারামিটার প্যারেমিটারগুলি পর্যাপ্ত অপ্টিমাইজেশন স্থান সরবরাহ করে। সামগ্রিকভাবে, কৌশলটি উদ্ভাবনী, যুক্তিসঙ্গত এবং খুব শক্তিশালী ব্যবহারিক। যদি প্যারামিটারগুলি সঠিক উপায়ে অপ্টিমাইজ করা হয় তবে এটি একটি খুব শক্তিশালী ট্রেন্ড অনুসরণকারী সিস্টেম হতে পারে।

কৌশল সোর্স কোড
/*backtest
start: 2022-10-31 00:00:00
end: 2023-02-14 00:00:00
period: 1d
basePeriod: 1h
exchanges: [{"eid":"Futures_Binance","currency":"BTC_USDT"}]
*/

// This source code is subject to the terms of the Mozilla Public License 2.0 at https://mozilla.org/MPL/2.0/
// © MarkoP010 2023

//@version=5
//The basic idea of the strategy is to select the best set of MAs, types, lenghts and offsets, which draws red trend bands for downtrend (and green for uptrend).
//Strategy executes by selected risk level either when there is MA crossover with price (MA1 Offset1 on Highest risk level, MA2 on Low risk level) or three bands with the same color on at the same time (on Lowest risk level).
//Strategy plots user selectable Moving Average lines and a colored trend band between the MA lines. The trend bands can be turned off individually if required.
//The Offset option shifts the selected MA with the set number of steps to the right. That is where the Magic happens and the Dragon roars!

//Strategy version 1.0
strategy("Flying Dragon Trend Strategy", shorttitle="FD Trend Strategy", overlay=true, pyramiding=3, initial_capital=100000, default_qty_type=strategy.percent_of_equity, default_qty_value=5, commission_type=strategy.commission.cash_per_order, commission_value=10, calc_on_order_fills=false, process_orders_on_close=true)

strDirection = input.string(defval="Both", title="Strategy Direction", options=["Both", "Long", "Short"], group="Strategy") //Strategy direction selector by DashTrader
strSelection = strDirection == "Long" ? strategy.direction.long : strDirection == "Short" ? strategy.direction.short : strategy.direction.all //Strategy direction selector by DashTrader
strategy.risk.allow_entry_in(strSelection)

riskLevel = input.string(defval="Medium", title="Risk Level", options=["Highest", "High", "Medium", "Low", "Lowest"], tooltip="Strategy execution criteria. When Highest then MA1 Offset1 crossover with price, when Low then MA2 Offset crossover, when Lowest then all the Bands are the same color.", group="Strategy")

useStop = input(defval=false, title="Use Stop Loss", inline="SL", group="Strategy")
stopPrct = input.int(defval=10, title=" %", minval=0, maxval=100, step=1, inline="SL", group="Strategy") / 100

//Moving Averages function
MA(source, length, type) =>
    type == "EMA" ? ta.ema(source, length) :
     type == "HMA" ? ta.hma(source, length) :
     type == "RMA" ? ta.rma(source, length) :
     type == "SMA" ? ta.sma(source, length) :
     type == "SWMA" ? ta.swma(source) :
     type == "VWMA" ? ta.vwma(source, length) :
     type == "WMA" ? ta.wma(source, length) :
     na

//Inputs
ma1Type = input.string(defval="HMA", title="", inline="MA1", options=["EMA", "HMA", "RMA", "SMA","SWMA", "VWMA", "WMA"], group="Leading Moving Average") 
ma1Length = input.int(defval=35, title="",minval=1, inline="MA1", group="Leading Moving Average")
ma1Source = input(defval=close, title="", tooltip="For short timeframes, minutes to hours, instead of Default values try Lowest risk level and HMA75 with Offsets 0,1,4 and SMA12 with Offset 6.", inline="MA1", group="Leading Moving Average")
ma1Color  = input(defval=color.purple, title="", inline="MA-1", group="Leading Moving Average")
//useMa1Offset = input(defval=false, title="Use offset to MA-1", inline="MA1", group="Leading Moving Average")
ma1Offset = input.int(defval=0, title="Offset1 Steps", minval=0, maxval=10, step=1, tooltip="The Magic happens here! The offset to move the line to the right.", inline="MA-1", group="Leading Moving Average")
ma1 = MA(ma1Source, ma1Length, ma1Type)[ma1Offset]

ma2Color  = input(defval=color.lime, title="", inline="MA-2", group="Leading Moving Average")
//useMa2Offset = input(defval=true, title="Use offset to MA2", inline="MA-2", group="Leading Moving Average")
ma2Offset = input.int(defval=4, title="Offset2 Steps", minval=0, maxval=10, step=1, tooltip="The Magic happens here! The offset to move the line to the right.", inline="MA-2", group="Leading Moving Average")
ma2 = ma1[ma2Offset]

ma3Color  = input(defval=color.aqua, title="", inline="MA-3", group="Leading Moving Average")
//useMa3Offset = input(defval=false, title="Use offset to MA3", inline="MA-3", group="Leading Moving Average")
ma3Offset = input.int(defval=6, title="Offset3 Steps", minval=0, maxval=10, step=1, tooltip="The Magic happens here! The offset to move the line to the right.", inline="MA-3", group="Leading Moving Average")
ma3 = ma1[ma3Offset]

ma4Type = input.string(defval="SMA", title="", inline="MA4", options=["EMA", "HMA", "RMA", "SMA","SWMA", "VWMA", "WMA"], group="Lagging Moving Average") 
ma4Length = input.int(defval=22, title="",minval=1, inline="MA4", group="Lagging Moving Average")
ma4Source = input(defval=close, title="", inline="MA4", group="Lagging Moving Average")
ma4Color  = input(defval=color.yellow, title="", inline="MA-4", group="Lagging Moving Average")
//useMa4Offset = input(defval=true, title="Use offset to MA4", inline="MA-4", group="Lagging Moving Average")
ma4Offset = input.int(defval=2, title="Offset Steps", minval=0, maxval=10, step=1, tooltip="The Magic happens here! The offset to move the line to the right.", inline="MA-4", group="Lagging Moving Average")
ma4 = MA(ma4Source, ma4Length, ma4Type)[ma4Offset]

bandTransp = input.int(defval=60, title="Band Transparency", minval=20, maxval=80, step=10, group="Banding")
useBand1 = input(defval=true, title="Band 1", inline="Band", group="Banding")
band1Transp = useBand1 ? bandTransp : 100
band1clr = ma1 > ma2 ? color.new(#00ff00, transp=band1Transp) : color.new(#ff0000, transp=band1Transp)
useBand2 = input(defval=true, title="Band 2", inline="Band", group="Banding")
band2Transp = useBand2 ? bandTransp : 100
band2clr = ma1 > ma3 ? color.new(#00ff00, transp=band2Transp) : color.new(#ff0000, transp=band2Transp)
useBand3 = input(defval=true, title="Band 3", tooltip="Up trend green, down trend red. Colors get reversed if MA1 lenght is greater than MA2 lenght, or they are different type and MA2 quicker. In that case, just reverse your selections for MA1 and MA2, or let it be as is.", inline="Band", group="Banding")
band3Transp = useBand3 ? bandTransp : 100
band3clr = ma1 > ma4 ? color.new(#00ff00, transp=band3Transp) : color.new(#ff0000, transp=band3Transp)

//Graphs
piirto1 = plot(ma1, color = ma1Color, title="MA1")
piirto2 = plot(ma2, color = ma2Color, title="MA2")
piirto3 = plot(ma3, color = ma3Color, title="MA3")
piirto4 = plot(ma4, color = ma4Color, title="MA4")

fill(piirto1, piirto2, color=band1clr)
fill(piirto1, piirto3, color=band2clr)
fill(piirto1, piirto4, color=band3clr)

//Strategy entry and stop conditions

longCondition = riskLevel == "Highest" ? ma1Source > ma1 : riskLevel == "High" ? ma1Source > ma2 : riskLevel == "Medium" ? ma1Source > ma3 : riskLevel == "Low" ? ma1Source > ma4 : riskLevel == "Lowest" ? ma1 > ma2 and ma1 > ma3 and ma1 > ma4 : na
shortCondition = riskLevel == "Highest" ? ma1Source < ma1 : riskLevel == "High" ? ma1Source < ma2 : riskLevel == "Medium" ? ma1Source < ma3 : riskLevel == "Low" ? ma1Source < ma4 : riskLevel == "Lowest" ? ma1 < ma2 and ma1 < ma3 and ma1 < ma4 : na

stopLprice = useStop == true ? strategy.position_avg_price * (1-stopPrct) : na
stopSprice = useStop == true ? strategy.position_avg_price * (1+stopPrct) : na

if (longCondition)
    strategy.entry("Long",strategy.long)
    strategy.exit("Long Stop", "Long", stop=stopLprice)    
if (shortCondition)
    strategy.entry("Short",strategy.short)
    strategy.exit("Short Stop", "Short", stop=stopSprice)

//End