ট্রিপল সুপারট্রেন্ড মুভিং এভারেজ ব্রেকআউট কৌশল
ওভারভিউ
ট্রিপল সুপারট্রেন্ডেড গড়রেখার ব্রেকিং কৌশলটি একটি সাধারণ কৌশল যা বিভিন্ন প্যারামিটার সেট করা সুপারট্রেন্ডেড গড়রেখার সাথে সংজ্ঞায়িত প্রবণতা ইএমএ ব্যবহার করে ট্রেডিংয়ের দিকনির্দেশনা এবং ট্রেডিংয়ের জন্য। এই কৌশলটির মূল ধারণাটি হ’ল যখন কমপক্ষে দুটি সুপারট্রেন্ডেড গড়রেখার সংজ্ঞায়িত প্রবণতা ইএমএর উপরে একটি মাল্টিপল থাকে তখন একটি মাল্টিপল তৈরি করা; যখন কমপক্ষে দুটি সুপারট্রেন্ডেড গড়রেখার সংজ্ঞায়িত প্রবণতা ইএমএর নীচে একটি ফাঁকা অবস্থায় থাকে তখন একটি ফাঁকা তৈরি করা।
কৌশল নীতি
এই কৌশলটি সুপার ট্রেন্ড গড়রেখার তিনটি ভিন্ন প্যারামিটার এবং একটি EMA দ্বারা নির্ধারিত হয় যা বড় ট্রেন্ডের দিকনির্দেশনা দেয়ঃ
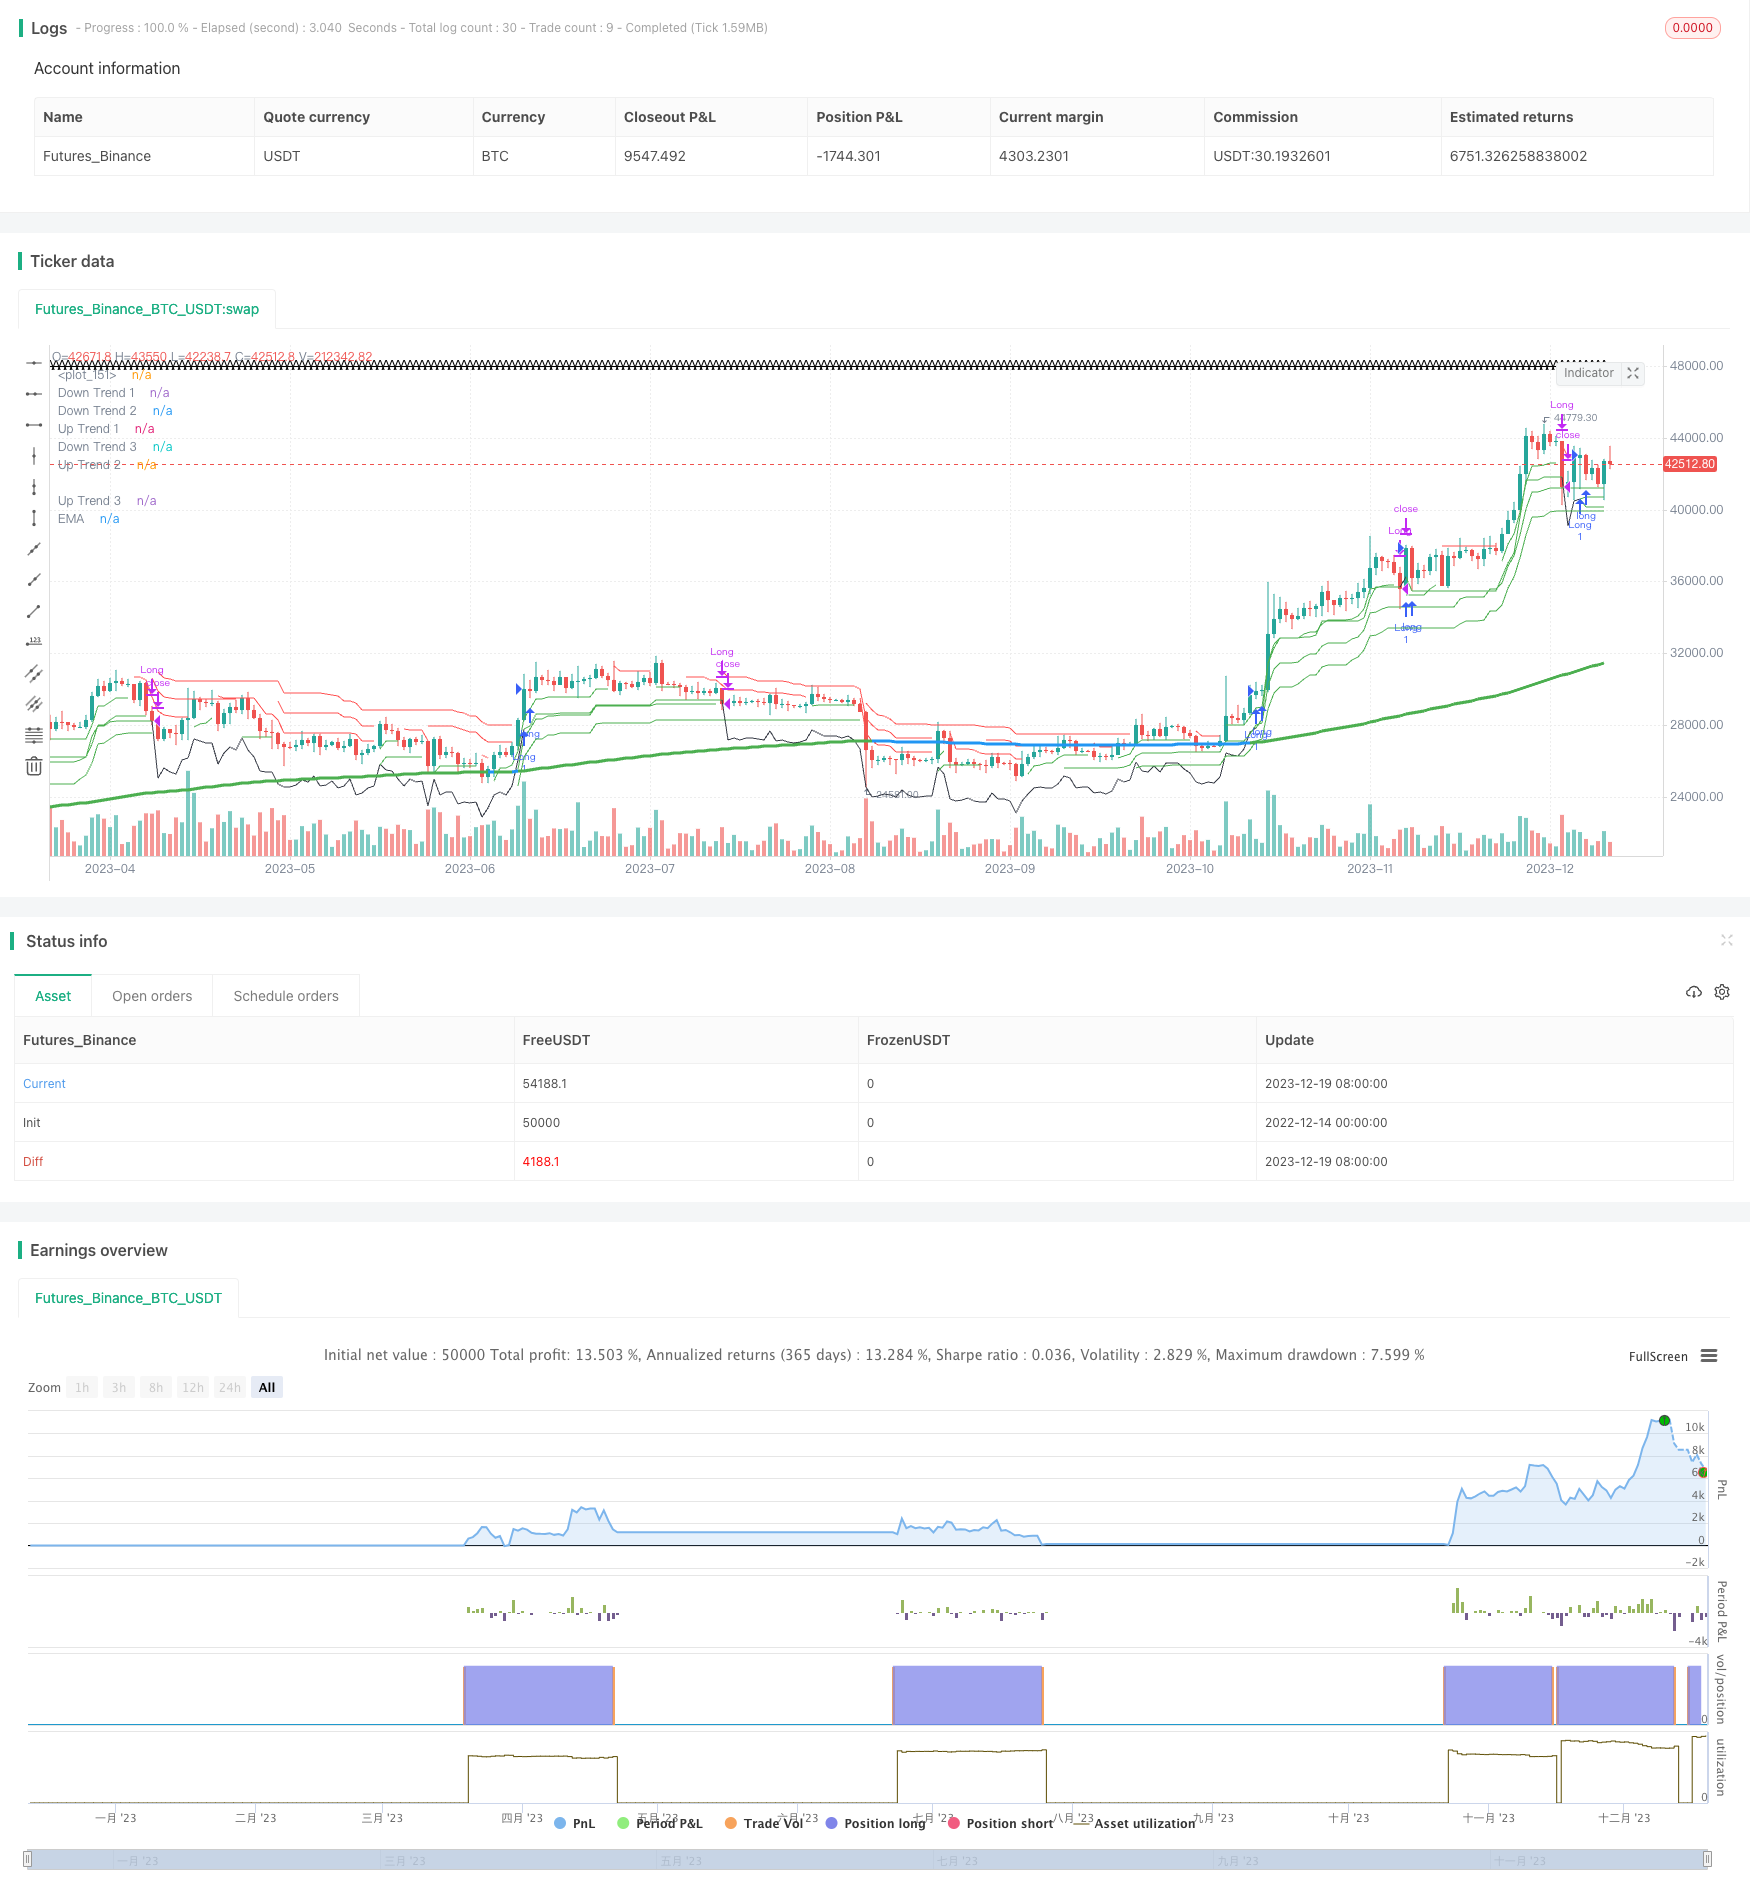
সুপারট্রেন্ড 1, সুপারট্রেন্ড 2 এবং সুপারট্রেন্ড 3 এর তিনটি সুপারট্রেন্ডের সমান্তরাল লাইন সেট করুন। সবুজ রঙের উত্থান প্রবণতা এবং লাল পতন প্রবণতা।
একটি EMA সমতল চলমান গড় ematrend সেট করুন যা বড় প্রবণতা সংজ্ঞায়িত করে, যখন তিনটি সুপারট্রেন্ডিং গড় এই EMA এর চেয়ে বেশি হয় তখন এটি বড় প্যাকেজ মাল্টিপ্লেয়ার হিসাবে সংজ্ঞায়িত করা হয়, বিপরীতভাবে এটি ফাঁকা প্যাকেজ হিসাবে সংজ্ঞায়িত করা হয়।
যখন কমপক্ষে দুটি অতিপ্রবণতা গড়রেখা একই সাথে বড় ডিস্কের একাধিক প্রান্তের ক্ষেত্রে একই সাথে প্রদর্শিত হয়, তখন এটি একটি মাল্টি-হেড সংকেত হিসাবে বিবেচিত হয়। যখন কমপক্ষে দুটি অতিপ্রবণতা গড়রেখা একই সাথে বড় ডিস্কের শূন্য প্রান্তের ক্ষেত্রে একই সাথে শূন্য প্রান্ত প্রদর্শিত হয়, তখন এটি শূন্য প্রান্তের সংকেত হিসাবে বিবেচিত হয়।
এরপরে, সিগন্যালের সময় পজিশন খুলুন এবং অতিরিক্ত/ খালি করুন।
স্টপ লস কন্ডিশন সেট করুন। যেখানে ফিক্সড স্টপ লস হল রিস্ক রিটার্নের অনুপাত, অর্থাৎ লাভ-ক্ষতির অনুপাত ৩; এবং মোবাইল স্টপ লস হল একটি ATR অর্থাৎ ড্রপ লস।
যখন স্টপ লস বা স্টপ স্টপ শর্তগুলি ট্রিগার হয় তখন পজিশনটি বন্ধ করুন।
সামর্থ্য বিশ্লেষণ
এই কৌশলটির সুবিধাগুলো হলঃ
ট্রেন্ড সিগন্যালগুলিকে কার্যকরভাবে সনাক্ত করার জন্য, EMA-গুলিকে একটি ট্রিপল সুপারট্রেন্ড গড়রেখার সাথে মিলিত করে ট্রেন্ড নির্ধারণ করা হয়।
বহুভুজ শর্তাদির বিচার সুস্পষ্ট, সহজে বোঝা যায় এবং বাস্তবায়িত হয়।
মোবাইল স্টপ এবং ফিক্সড স্টপ সেট করুন, কার্যকরভাবে ঝুঁকি নিয়ন্ত্রণ করুন।
প্রয়োজন অনুসারে হাইপারপ্যারামিটারগুলি সামঞ্জস্য করা যায়, কৌশলটি অনুকূলিতকরণ করা যায়।
ঝুঁকি বিশ্লেষণ
এই কৌশলটি কিছু ঝুঁকি নিয়েও এসেছেঃ
অপ্রয়োজনীয় হাইপারপ্যারামিটার সেট করা ভাল ব্যবসায়ের সুযোগগুলি মিস করতে পারে। বিভিন্ন এটিআর চক্র, এটিআর গুণক এবং ইএমএ চক্রের প্যারামিটার পরীক্ষা করা যেতে পারে।
বিপর্যয়ের সম্ভাবনা আছে, তবে এটি হ্রাস করা যেতে পারে হাইপারপ্যারামিটারগুলি সামঞ্জস্য করে।
স্টপ লস বা স্টপ স্টপ সেট করা খুব হালকা হলে ক্ষতির সম্ভাবনা বাড়বে। স্টপ লসের পরিধি যথাযথভাবে সংকীর্ণ করা উচিত।
পুনরুদ্ধার করা ডেটা খুব সহজেই ওভারফিট সমস্যা সৃষ্টি করতে পারে। মাল্টি মার্কেট মাল্টি সাইকেল টেস্টের দিকে মনোযোগ দেওয়া উচিত।
অপ্টিমাইজেশান দিক
এই কৌশলটি নিম্নলিখিত দিকগুলি থেকে উন্নত করা যেতে পারেঃ
সর্বোত্তম সুপারপ্যারামিটার সমন্বয় পরীক্ষা করুন। বিভিন্ন এটিআর চক্র, এটিআর গুণক এবং ইএমএ গড় চক্রের সমন্বয় পরীক্ষা করে সর্বোত্তম প্যারামিটার খুঁজে বের করতে পারেন।
ট্রেডিং প্রকারভেদ যোগ করুন: কৌশলটি কার্যকর করার জন্য বিভিন্ন প্রকারভেদ যেমন স্টক, ডিজিটাল মুদ্রা যোগ করা যেতে পারে।
অন্যান্য সূচকগুলির সাথে মিলিতভাবে সংকেতগুলি ফিল্টার করুন। উদাহরণস্বরূপ, আপনি আরএসআই, এমএসিডি ইত্যাদির মতো সূচকগুলি যুক্ত করতে পারেন যাতে প্রবণতা সংকেতগুলি ভুলভাবে পড়তে না পারে।
অপ্টিমাইজেশন স্টপ লস স্টপ মেকানিজম। এটি ট্র্যাকিং স্টপ বা এটিআর / ওঠানামা পরিবর্তনের উপর ভিত্তি করে স্টপ লস পদ্ধতি পরীক্ষা করতে পারে।
সারসংক্ষেপ
ট্রিপল সুপারট্রেন্ড গড়রেখা বিরতি কৌশলটি সামগ্রিকভাবে একটি সহজ এবং ব্যবহারিক প্রবণতা অনুসরণ কৌশল। এটি একই সাথে একাধিক সুপারট্রেন্ড গড়রেখা এবং প্রবণতা বিচার ইএমএর সাথে মিলিত হয় যাতে সুযোগগুলি আবিষ্কার করা যায় এবং ঝুঁকিগুলি কার্যকরভাবে নিয়ন্ত্রণ করা যায়। প্যারামিটার অপ্টিমাইজেশন এবং নিয়ম অপ্টিমাইজেশনের মাধ্যমে আরও ভাল ফলাফল পাওয়া যায়। এই কৌশলটি বোঝা সহজ এবং এটি শেখার জন্য মূল্যবান।
/*backtest
start: 2022-12-14 00:00:00
end: 2023-12-20 00:00:00
period: 1d
basePeriod: 1h
exchanges: [{"eid":"Futures_Binance","currency":"BTC_USDT"}]
*/

// @version=5
// author=theasgard and moonshot-indicator (ms)
// year 2021
//
// This is a well knowen strategy by using 3 different Supertrends and a trend-defining EMA,
// feel free to play around with the settings, a backtest on 8h ETHUSDT pair brought some good results using
// the 233EMA and investing 75% of a 10k start capital
//
// the idea is to have at least 2 supertrnds going green above the trend-EMA to go long and exit by turning
// 2 supertrends red (idea: 1 supertrend in red could initialize a take profit)
// shorts work vice versa
// The EMA shows in green for uptrends and in red for downtrends, if it is blue no Signal will be taken because
// the 3 supertrends are not all above or below the trendline(EMA)
//
// Update 1:
// Fixed a minor input error
// Added ATR stoploss, and commented out the percentage stop loss
// Added time window to backtest
// Added exit on risk/revard is met
// This version is only buy...wait for next update adding shorts

strategy("ms hypertrender", overlay=true)

// set up 3 supertrendlines and colour the direction up/down
atrPeriod1 = input(10, "ATR Length 1")
factor1 = input.float(1.0, "ATR Factor 1", step = 0.01)
[supertrend1, direction1] = ta.supertrend(factor1, atrPeriod1)
upTrend1 = plot(direction1 < 0 ? supertrend1 : na, "Up Trend 1", color = color.green, style=plot.style_linebr)
downTrend1 = plot(direction1 < 0? na : supertrend1, "Down Trend 1", color = color.red, style=plot.style_linebr)

atrPeriod2 = input(11, "ATR Length 2")
factor2 = input.float(2.0, "ATR Factor 2", step = 0.01)
[supertrend2, direction2] = ta.supertrend(factor2, atrPeriod2)
upTrend2 = plot(direction2 < 0 ? supertrend2 : na, "Up Trend 2", color = color.green, style=plot.style_linebr)
downTrend2 = plot(direction2 < 0? na : supertrend2, "Down Trend 2", color = color.red, style=plot.style_linebr)

atrPeriod3 = input(12, "ATR Length 3")
factor3 = input.float(3.0, "ATR Factor 3", step = 0.01)
[supertrend3, direction3] = ta.supertrend(factor3, atrPeriod3)
upTrend3 = plot(direction3 < 0 ? supertrend3 : na, "Up Trend 3", color = color.green, style=plot.style_linebr)
downTrend3 = plot(direction3 < 0? na : supertrend3, "Down Trend 3", color = color.red, style=plot.style_linebr)

//set up the trend dividing EMA and color uptrend nutreal downtrend
len = input.int(233, minval=1, title="Trend-EMA Length")
src = input(close, title="Source")
offset = input.int(title="Offset", defval=0, minval=-500, maxval=500)

//general Bull or Bear Trend? Visualized by ema
ematrend = ta.ema(src, len)
generaluptrend = supertrend1 > ematrend and supertrend2 > ematrend and supertrend3 > ematrend
generaldowntrend = supertrend1 < ematrend and supertrend2 < ematrend and supertrend3 < ematrend
emacolor = if generaluptrend
    color.green
else if generaldowntrend
    color.red
else
    color.blue
plot(ematrend, title="EMA", color=emacolor, linewidth=3, offset=offset)

// Bullish? min 2 supertrends green
bullish = (direction1 < 0 and direction2 < 0) or (direction1 < 0 and direction3 < 0) or (direction2 < 0 and direction3 < 0) and generaluptrend
extremebullish = direction1 < 0 and direction2 < 0 and direction3 < 0 and generaluptrend //all 3 green

// Bearish? min 2 supertrends red
bearish = (direction1 > 0 and direction2 > 0) or (direction1 > 0 and direction3 > 0) or (direction2 > 0 and direction3 > 0) and generaldowntrend
extremebearish = direction1 > 0 and direction2 > 0 and direction3 > 0 and generaldowntrend //all 3 red

// Open Long
//plotchar(((bullish and not bullish[1]) or (extremebullish and not extremebullish[1])) and (emacolor==color.green)? close : na, title = 'Start Long', char='▲', color = #80eb34, location = location.belowbar, size = size.small)

// TP 10% Long
TP10long = ((generaluptrend and bullish[1]) or (generaluptrend and extremebullish[1])) and (direction1 > 0 or direction2 > 0 or direction3 > 0)
//plotchar(TP10long and not TP10long[1]? close : na, title = 'TP on Long', char='┼', color = #ffd000, location = location.abovebar, size = size.tiny)

// Exit Long
//plotchar(extremebearish and not extremebearish[1] or bearish and not bearish[1]? close : na, title = 'Close all Longs', char='Ꭓ', color = #ff0037, location = location.abovebar, size = size.tiny)
stopsupertrendup = if supertrend1 < supertrend2 and supertrend1 < supertrend3
    (supertrend1)
else if supertrend2 < supertrend1 and supertrend2 < supertrend3
    (supertrend2)
else if supertrend3 < supertrend1 and supertrend3 < supertrend2
    (supertrend3)
lowestLows = ta.lowest(low, 1)
// Open Short
//plotchar(((bearish and not bearish[1]) or (extremebearish and not extremebearish[1])) and (emacolor==color.red)? close : na, title = 'Start Short', char='▼', color = #0547e3, location = location.abovebar, size = size.small)

// TP 10% Short
TP10short = ((generaldowntrend and bearish[1]) or (generaldowntrend and extremebearish[1])) and (direction1 < 0 or direction2 < 0 or direction3 < 0)
//plotchar(TP10short and not TP10short[1]? close : na, title = 'TP on Short', char='┼', color = #ffd000, location = location.belowbar, size = size.tiny)

// Exit Short
//plotchar(extremebullish and not extremebullish[1] or bullish and not bullish[1]? close : na, title = 'Close all Shorts', char='Ꭓ', color = #ff0037, location = location.belowbar, size = size.tiny)
stopsupertrenddown = if supertrend1 > supertrend2 and supertrend1 > supertrend3
    (supertrend1)
else if supertrend2 > supertrend1 and supertrend2 > supertrend3
    (supertrend2)
else if supertrend3 > supertrend1 and supertrend3 > supertrend2
    (supertrend3)
highestHighs = ta.highest(high,1)
// Set stop loss level with input options (optional)
//longLossPerc = input.float(title="Long Stop Loss (%)",
//     minval=0.0, step=0.1, defval=1) * 0.01

//shortLossPerc = input.float(title="Short Stop Loss (%)",
//     minval=0.0, step=0.1, defval=1) * 0.01

// Determine stop loss price
//longStopPrice  = strategy.position_avg_price * (1 - longLossPerc)
//shortStopPrice = strategy.position_avg_price * (1 + shortLossPerc)

openlong = (extremebullish and not extremebullish[1]) and (emacolor==color.green)//(((bullish and not bullish[1]) or
openshort = (extremebearish and not extremebearish[1]) and (emacolor==color.red)//(((bearish and not bearish[1]) or
exitlong = lowestLows<(stopsupertrendup - ((stopsupertrendup / 100) * 0.1)) //(extremebearish and not extremebearish[1] or bearish and not bearish[1]) or TP10long or
exitshort = highestHighs>(stopsupertrenddown - ((stopsupertrenddown / 100) * 0.1)) //(extremebullish and not extremebullish[1] or bullish and not bullish[1]) or TP10short
//strategy.entry("buy", strategy.long, when=openlong)
//strategy.entry("sell", strategy.short, when=openshort)

//strategy.close("buy", when=exitlong)
//strategy.close("sell", when=exitshort)

// Submit exit orders based on calculated stop loss price
//if (strategy.position_size > 0)
//    strategy.exit(id="Long Stop", stop=longStopPrice)

//if (strategy.position_size < 0)
//    strategy.exit(id="Short Stop", stop=shortStopPrice)

backtest_timeframe_start = input(defval = timestamp("01 Apr 2016 13:30 +0000"), title = "Backtest Start Time")
USE_ENDTIME = input(false,title="Define the ending period for backtests (If false, will test up to most recent candle)")
backtest_timeframe_end = input(defval = timestamp("19 Mar 2021 19:30 +0000"), title = "Backtest End Time")
TARGET_PROFIT_MODE = input(false,title="Exit when Risk:Reward met")
REWARD_RATIO = input(3,title="Risk:[Reward] (i.e. 3) for exit")
// Trailing stop loss {
TSL_ON = input(true,title="Use trailing stop loss")
var entry_price = float(0)
ATR_multi_len = 26
ATR_multi = input(2, "ATR multiplier for stop loss")
ATR_buffer = ta.atr(ATR_multi_len) * ATR_multi
plotchar(ATR_buffer, "ATR Buffer", "A", location = location.top)
risk_reward_buffer = (ta.atr(ATR_multi_len) * ATR_multi) * REWARD_RATIO
take_profit_long = low > entry_price + risk_reward_buffer
take_profit_short = low < entry_price - risk_reward_buffer
var trailing_SL_buffer = float(0)
var stop_loss_price = float(0)
stop_loss_price := math.max(stop_loss_price, close - trailing_SL_buffer)
// plot TSL line
trail_profit_line_color = color.green
if strategy.position_size == 0  or not TSL_ON
    trail_profit_line_color := color.black
    stop_loss_price := close - trailing_SL_buffer
plot(stop_loss_price,color=trail_profit_line_color)
// }

if true
    buy_condition = openlong
    exit_condition = exitlong
    //ENTRY:
    if buy_condition
        if strategy.position_size == 0
            entry_price := close
            trailing_SL_buffer := ATR_buffer
            stop_loss_price := close - ATR_buffer

        msg = "entry"
        if strategy.position_size > 0
            msg := "pyramiding"
        strategy.entry("Long",strategy.long, comment=msg)

    //EXIT:
    // Case (A) hits trailing stop
    if TSL_ON and strategy.position_size > 0 and close <= stop_loss_price
        if close > entry_price
            strategy.close("Long", comment="take profit [trailing]")
        else if close <= entry_price
            strategy.close("Long", comment="stop loss")
    // Case (B) take targeted profit relative to risk
    if strategy.position_size > 0 and TARGET_PROFIT_MODE
        if take_profit_long
            strategy.close("Long", comment="take profits [risk:reward]")
    // Case (C)
    if strategy.position_size > 0 and exit_condition
        if take_profit_long
            strategy.close("Long", comment="exit[rsi]")