ডুয়াল মুভিং এভারেজ ক্রসওভার কৌশল ব্যবহার করা
ওভারভিউ
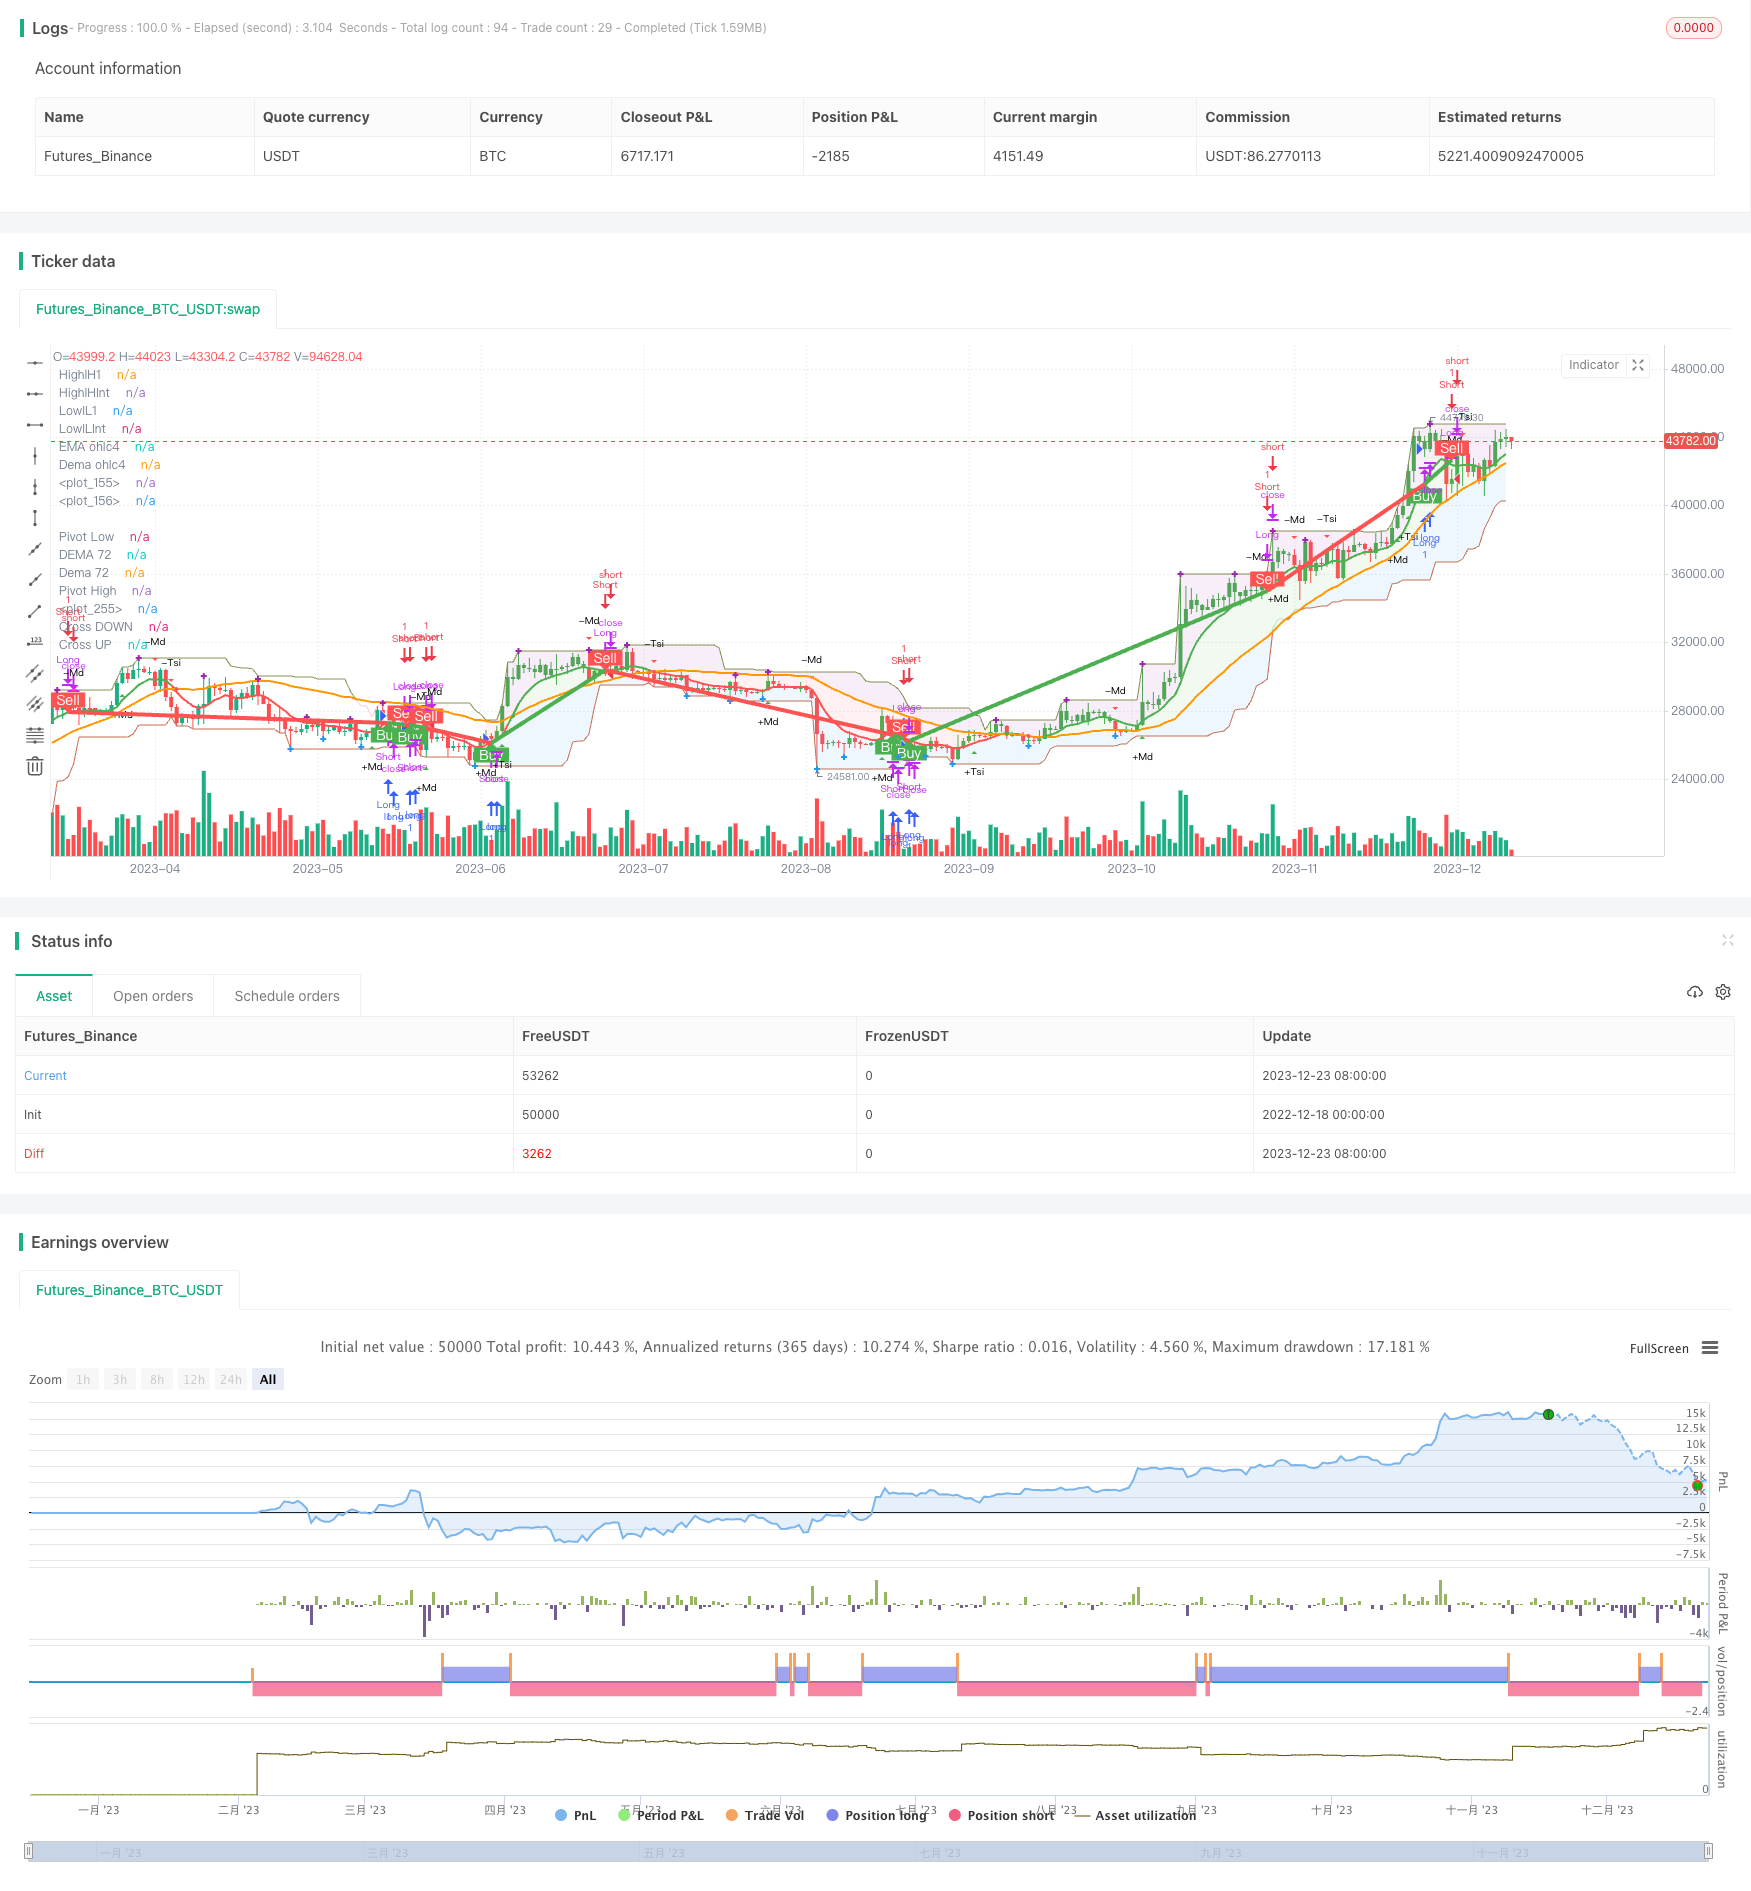
এটি একটি সহজ পরিমাণগত কৌশল যা ডাবল মুভিং এভারেজ ক্রসিংকে ক্রয় এবং বিক্রয় সংকেত হিসাবে ব্যবহার করে। এটি দুটি ভিন্ন পিরিয়ডের এমএ লাইন ব্যবহার করে, যখন একটি সংক্ষিপ্ত পিরিয়ড এমএ লাইন নীচে থেকে দীর্ঘ পিরিয়ড এমএ লাইন অতিক্রম করে তখন একটি কেনার সংকেত উত্পন্ন করে; যখন একটি সংক্ষিপ্ত পিরিয়ড এমএ লাইন উপরে থেকে নীচে দীর্ঘ পিরিয়ড এমএ লাইন অতিক্রম করে তখন একটি বিক্রয় সংকেত উত্পন্ন করে।
কৌশল নীতি
এই কৌশলটি ৮-চক্রের ইএমএ এবং ৭২-চক্রের ইএমএ গণনা করে এবং চার্টগুলিতে আঁকা হয়। ৮ ইএমএর উপরে ৭২ ইএমএ অতিক্রম করলে একটি কেনার সংকেত দেওয়া হয় এবং ৮ ইএমএর নিচে ৭২ ইএমএ অতিক্রম করলে একটি বিক্রয় সংকেত দেওয়া হয়।
কৌশলটির মূল অনুমানটি হ’লঃ স্বল্প মেয়াদী এমএ লাইনটি সাম্প্রতিক মূল্যের প্রবণতা এবং গতিশীলতা উপস্থাপন করে, দীর্ঘ মেয়াদী এমএ লাইনটি দীর্ঘমেয়াদী প্রবণতা উপস্থাপন করে। যখন সংক্ষিপ্ত এমএ দীর্ঘ এমএ অতিক্রম করে, তখন স্বল্পমেয়াদী প্রবণতা শক্তিশালী হচ্ছে এবং দামকে দীর্ঘমেয়াদী গড়ের বাইরে নিয়ে যায়, তাই এটি কিনতে পারে। যখন সংক্ষিপ্ত এমএ নীচে দীর্ঘ এমএ অতিক্রম করে, তখন স্বল্পমেয়াদী উত্থান শেষ হয়ে গেছে এবং দীর্ঘমেয়াদী সমর্থনটি ভেঙে গেছে, বিক্রয় বিবেচনা করা উচিত।
এই কৌশলটি উইলিয়াম %R সূচককে ওভারবয় ওভারসোল অঞ্চল নির্ধারণের জন্য ব্যবহার করে এবং MACD সূচকটি দামের গতিশীলতার দিকনির্দেশের জন্য ট্রেডিং সিদ্ধান্তের জন্য রেফারেন্স সরবরাহ করে। এছাড়াও, কৌশলটিতে কিছু সহায়ক সূচক যেমন ডেমা, পিভটস ইত্যাদি রয়েছে যা ট্রেন্ড বিশ্লেষণে সহায়তা করে।
সামর্থ্য বিশ্লেষণ
ডাবল এমএ ক্রস কৌশলগুলির সর্বাধিক সুবিধা হ’ল এটি সহজেই বোঝা যায় এবং সহজেই বাস্তবায়ন করা যায়। কেবলমাত্র দুটি এমএর ক্রসের উপর নির্ভর করে কোনও জটিল মডেল এবং প্যারামিটার অপ্টিমাইজেশনের প্রয়োজন ছাড়াই নিয়ম অনুসারে ট্রেডিং সিগন্যাল তৈরি করা যায়।
আরেকটি সুবিধা হল, MA ক্রস কৌশলটি ট্রেন্ডিং বাজারগুলিতে ভাল কাজ করে। যখন শেয়ারের দামের একটি সুস্পষ্ট উত্থান বা পতনের প্রবণতা থাকে, তখন MA ক্রস কৌশলটি বড় প্রবণতা ধরে ভাল আয় করতে পারে।
ঝুঁকি বিশ্লেষণ
ডাবল এমএ ক্রস কৌশলগুলির কিছু ঝুঁকিও রয়েছে যা সম্পর্কে সতর্কতা অবলম্বন করা দরকার। প্রথমত, অস্থির বাজারগুলিতে, এমএ লাইন ক্রস ঘন ঘন হয়, যা ভুল সংকেত এবং চেইন ক্ষতির জন্য প্রবণ। দ্বিতীয়ত, এমএ ক্রস সংকেতগুলি প্রায়শই দেরিতে থাকে এবং হঠাৎ ঘটনার প্রভাবকে সময়মতো প্রতিফলিত করতে পারে না। অবশেষে, এমএ চক্রের দৈর্ঘ্যের মতো প্যারামিটার সেটিংয়ের জন্য অভিজ্ঞতার বিচার প্রয়োজন।
অন্যান্য সূচকগুলির সাথে সংযুক্ত করে সংকেতগুলি নিশ্চিত করতে, এমএ প্যারামিটারগুলি অনুকূলিতকরণ করতে বা প্রবণতা স্পষ্ট বাজারের ক্রিয়াকলাপে ঝুঁকি হ্রাস করতে পারে। স্টপ লস স্টপ সেট করা এবং পজিশন পরিচালনা করাও গুরুত্বপূর্ণ।
অপ্টিমাইজেশান দিক
এই সহজ ডাবল এমএ কৌশলটি নিম্নলিখিত দিকগুলিতে অপ্টিমাইজ করা যেতে পারেঃ
- বিভিন্ন এমএ পিরিয়ড প্যারামিটারের সমন্বয় পরীক্ষা করে সেরা প্যারামিটার খুঁজুন;
২. কৌশলকে আরও স্থিতিশীল করতে অন্যান্য সূচক যেমন MACD, KDJ ইত্যাদি সংকেত ফিল্টার করা;
একটি গতিশীল প্রস্থান ব্যবস্থা স্থাপন করা, যা কেবলমাত্র স্থির মান ব্যবহারের পরিবর্তে সর্বোত্তম স্টপ-অফ-স্টপ অবস্থানগুলিকে ট্র্যাক করে;
বাজারের অবস্থার উপর ভিত্তি করে এমএ চক্রের অভিযোজন এবং অপ্টিমাইজেশান প্যারামিটার;
উচ্চতর মেশিন লার্নিং এবং গভীর শিক্ষণ মডেলের সাথে সংযুক্ত করে ভবিষ্যদ্বাণী করা, সংকেতের নির্ভুলতা উন্নত করা।
সারসংক্ষেপ
এই কৌশলটি একটি সহজ ডাবল এমএ ক্রস কৌশল হিসাবে কাজ করে, যদিও কিছু স্থগিতাদেশ এবং মিথ্যা সংকেত সমস্যা রয়েছে, তবে এটি সহজেই বোঝা এবং বাস্তবায়ন করা যায়। কিছু অপ্টিমাইজেশান সংশোধন করে, এটি এখনও একটি মৌলিক এবং কার্যকর পরিমাণগত ট্রেডিং কৌশল হতে পারে।
/*backtest
start: 2022-12-18 00:00:00
end: 2023-12-24 00:00:00
period: 1d
basePeriod: 1h
exchanges: [{"eid":"Futures_Binance","currency":"BTC_USDT"}]
*/

// This source code is subject to the terms of the Mozilla Public License 2.0 at https://mozilla.org/MPL/2.0/
// © DalmarSantos
//@version=4
//Entry and Exit points to TRADE ==> Pontos de Entrada e Saida de TRADE
//Functions in use ==> Funções em uso
//(1) DEMA - Double Exponential Moving Average 08/17/34/72 ==> Média Móvel Exponencial Dupla
//(2) ema() - Exponential Moving Averge 72/ochl4 ==> Média Móvel Exponencial
//(3) plot()
//(4) barcolor()
//(5) cross()
//(6) pivots()
//(7) William R% Md
//(8) Maximum and Minimum Value
//(9) fill()
//(10) macd() - Moving Average Convergence Divergence
//(11) tsi() - Trading Strenght Indicator==> Índice de Força Real (IFR)
//(12) Buy and Sell TRADE Points
//(13) Strategy Buy and Sell TRADE Points
strategy("[DS]Entry_Exit_TRADE.V01-Strategy", overlay=true)
//variable ==> variáveis
return = input(title="Return Candels ?", type=input.integer, defval=190) //quantity of candles to analise ==> quantidade de candles para analise
//
//****************************
//Function==> Função | (1)DEMA
//****************************
//Dema 08
e1 = ema(close,8)
e2 = ema(e1,8)
dema08 = 2 * e1 - e2
//
//Dema 17
e1 := ema(close,17)
e2 := ema(e1,17)
dema17 = 2 * e1 - e2
//
//Dema 34
e1 := ema(close,34)
e2 := ema(e1,34)
dema34 = 2 * e1 - e2
//
//Dema 72
e1 := ema(close,72)
e2 := ema(e1,72)
dema72 = 2 * e1 - e2
//
//******************************
//Function==> Função | (2) ema()
//******************************
ema72 = ema(close,72)
emaOhlc4=ema(ohlc4,8)
//
//******************************
//Function==> Função | (3)plot()
//******************************
//
////Show the avareges ==> Apresenta as médias
//plot(dema17, title="DEMA 17", color=color.new(color.lime,0), linewidth=1, style=plot.style_line, transp=0, show_last=return) // Doble Exponential Moving Avarage 17
//plot(dema34, title="DEMA 34", color=color.new(color.black,0), linewidth=1, style=plot.style_line, transp=0, show_last=return) // Doble Exponential Moving Avarage 34

plot(dema72, title="DEMA 72", color=color.orange, linewidth=2, style=plot.style_line, transp=0, show_last=return) // Doble Exponential Moving Avarage 72
plot(emaOhlc4, title="EMA ohlc4", color=emaOhlc4>dema72 ? color.new(color.green,0) : color.new(color.red,0), linewidth=2, style=plot.style_line, transp=0, show_last=return) // Doble Exponential Moving Avarage 72
//
//***********************************
//Function==> Função | (4) barcolor()
//***********************************
//Show color TRADE bar if emaOhlc4>dema72 green (Buy) if not red (Red) ==> Mostra a cor da barra de TRADE se emaOhlc4>dema72 verde (Compra) se não vermelha (Venda)
barcolor(close>dema34 and close>dema72 or close>close[1]  ? color.new(color.green,0) : color.new(color.red,0), show_last=return)
//
//********************************
//Function==> Função | (5) cross()
//********************************
// Show the intersections crossing average on the graph ==> Apresenta no gráfico o local dos cruzamentos das médias
//UP ==> para CIMA
plot(crossover(emaOhlc4,dema72) ? dema72 : na, title="Cross UP", color=color.green, transp=0, style=plot.style_circles, linewidth=5, show_last=return)
//DOWM ==> para BAIXO
plot(crossunder(emaOhlc4,dema72) ? dema72 : na, title="Cross DOWN", color=color.red, transp=50, style=plot.style_circles, linewidth=5, show_last=return)
//
//********************************
//Function==> Função | (6) pivot()
//Reference: Pine Script Manual
//********************************
_Pivots	= input(title = "══════ Pivots ══════", type = input.bool, defval = false)
leftBars = input(4)
rightBars=input(4)
pivotHigh = pivothigh(leftBars, rightBars) //pivot de alta
plot(pivotHigh>ema72[rightBars] ? pivotHigh : na, title="Pivot High", style=plot.style_cross, linewidth=3, color= color.purple, transp=50, offset=-rightBars, show_last=return)
pivotLow = pivotlow(leftBars, rightBars) //pivot de baixa
plot(pivotLow<ema72[rightBars] ? pivotLow : na, title="Pivot Low", style=plot.style_cross, linewidth=3, color= color.blue, transp=50, offset=-rightBars, show_last=return)
//
//***************************************
//Function==> Função | (7) WILLIAM R% MOD
//Reference: Pine Script Manual
//***************************************
// Getting inputs
_WilliamR	= input(title = "══════ William R% Mod ══════", type = input.bool, defval = false)
SOB_William = input(title="OverBought Area", type=input.integer, defval=-7) //OverBought area ==> Area de SobreCompra
SOS_William = input(title="OverSold Area", type=input.integer, defval=-93) //OverSold area ==> Area de SobreVenda
length_William = input(17, minval=1) //interval ==> intervalo
highestHigh_William = highest(length_William) //maximum value ==> valor máximo
highestLow_William = lowest(length_William) //minumum value ==> valor mínimo
R_William = (highestHigh_William - close) / (highestHigh_William - highestLow_William) * -100
//Show the position ==> mostra a posição
//plotshape(R_William > SOS_William ? na : high, text="+R%", title="+r(+)%R Up", location=location.belowbar, color=color.green, transp=30, style=shape.triangleup, size=size.tiny, show_last=return)
//plotshape(R_William < SOB_William ? na : low, text="-R%", title="(-)%R DN", location=location.abovebar, color=color.red, transp=30, style=shape.triangledown, size=size.tiny, show_last=return)
//
// Show label with William %R value ==> Mostra a etiqueta com o valor do William %R
// The color label red is when the value arrive on OverBought Area and green on OverSold Area, be careful with these areas ==> O rótulo de cor vermelha é quando o valor chega na área de SobreCompra e verde na área de SobreVenda, cuidado com estas áreas
//
corTest=color.white
colorText = color.white
estilo = label.style_label_upper_left
textW=""
if R_William>SOB_William
    corTest := color.new(color.red,0) //vermelho escuro
    estilo := label.style_label_lower_left
    textW:="OB"

if R_William>-30 and R_William<=SOB_William
    corTest := #f5948e //vermelho intermediário
    estilo := label.style_label_lower_left

if R_William>-50 and R_William<=-30
    corTest := #f5d5d3 //vermelho claro
    colorText := color.black

if R_William>-70 and R_William<=-50
    corTest := #e7f5d3 //verde claro
    colorText := color.black

if R_William>=SOS_William and R_William<=-70
    corTest := color.lime //verde intermediario
    estilo := label.style_label_upper_left
    colorText := color.black

if R_William<SOS_William
    corTest := color.new(color.green,0) // verde escuro
    estilo := label.style_label_upper_left
    textW:="OS"
// Make a label at the high of the current bar
myLabel = label.new(x=bar_index, y=close, style= estilo, color=corTest, text=tostring(R_William,"#.#")+"% "+textW, textcolor=colorText, size=size.normal)
// Get the label text
labelText = label.get_text(id=myLabel)
// Then set the label's text to a new string that
// includes its current text
label.set_text(id=myLabel, text=labelText)
label.delete(myLabel[1])
//
//**************************************************
//Function==> Função | (8) MAXIMUM AND MINIMUM VALUE
//Reference: Pine Script Manual
//**************************************************
//Maximum High and Minimum Low close position ==> Posição Máxima e Minima de fechamento
ExtremoHigh=high+(highestHigh_William-high)
ExtremoLow=low-(low-highestLow_William)
plot(ExtremoHigh, color=color.new(color.red,70), style=plot.style_line, linewidth=1, show_last=return)
plot(ExtremoLow, color=color.new(color.green,70), style=plot.style_line, linewidth=1, show_last=return)
//Show the Extreme High and Low close position ==> Mostra a extrema posicao alta e baixa do fechamento
lH1 = 0.0
lHInt = close
lL1 = close
lLInt = close
Vr_LinhaH=0.0
Vr_LinhaL=0.0
Vr_LinhaC=0.0
if emaOhlc4<dema72
    Vr_LinhaH := high+(highestHigh_William-high)
    lH1 := Vr_LinhaH>dema72 ?  Vr_LinhaH : dema72
    lHInt:=emaOhlc4<dema72 ? dema72 : emaOhlc4
    lLInt := lHInt==emaOhlc4 ? dema72 : emaOhlc4
    Vr_LinhaL:= low-(low-highestLow_William)
    lL1 := Vr_LinhaL>lLInt ?  lLInt : Vr_LinhaL

if emaOhlc4>dema72
    Vr_LinhaH := high+(highestHigh_William-high)
    lH1 := Vr_LinhaH>dema72 ?  Vr_LinhaH : dema72
    lHInt:=dema72>emaOhlc4 ? dema72 : emaOhlc4
    lLInt := lHInt==dema72 ? emaOhlc4 : dema72
    Vr_LinhaL:= low-(low-highestLow_William)
    lL1 := Vr_LinhaL>lLInt ?  lLInt : Vr_LinhaL
//
//*******************************
//Function==> Função | (9) fill()
//Reference: Pine Script Manual
//*******************************
//Show TRADE area in red (Sell) and green (Buy) ==> Mostra a área de trade em vermelho (Venda) e verde (Compra)
Line1 = plot(emaOhlc4, title="Dema ohlc4", color=color.new(color.white,100), linewidth=1, transp=0, show_last=return)
Line2 = plot(dema72,  title="Dema 72", color=color.new(color.white,100), linewidth=1,transp=0, show_last=return)
fill(Line1, Line2, color=emaOhlc4>dema72 ? color.new(color.green,90) : color.new(color.red,90), transp=70, show_last=return)

//High area ==> Area de alta
HighlH1 = plot(lH1, title="HighlH1", color=color.green, linewidth=1, transp=90, show_last=return, style=plot.style_linebr)
HighlHInt = plot(lHInt, title="HighlHInt", color=color.green, linewidth=1, transp=100, show_last=return, style=plot.style_linebr)
fill(HighlH1, HighlHInt, color=color.new(color.purple,90),  transp=0, show_last=return)

//Low area ==> Area de baixa
LowlL1 = plot(lL1, title="LowlL1", color=color.red, linewidth=1, transp=90, show_last=return, style=plot.style_linebr)
LowlLInt = plot(lLInt, title="LowlLInt", color=color.red, linewidth=1, transp=100, show_last=return, style=plot.style_linebr)
fill(LowlL1, LowlLInt, color=color.new(color.blue,90),  transp=0, show_last=return)
//
//***************************************************************************
//Function==> Função | (10) macd() - Moving Average Convergence Divergence
//Reference: Pine Script Manual - adapted TradingView version - Dalmar Santos
//***************************************************************************
// Getting inputs
_Macd	= input(title = "═════ Macd ══════════", type = input.bool, defval = false)
fast_length_Macd = input(title="Fast Length", type=input.integer, defval=12)
slow_length_Macd = input(title="Slow Length", type=input.integer, defval=26)
src_Macd = input(title="Source", type=input.source, defval=close)
signal_length_Macd = input(title="Signal Smoothing", type=input.integer, minval = 1, maxval = 50, defval = 9)
// Calculating
fast_ma_Macd = ema(src_Macd, fast_length_Macd)
slow_ma_Macd = ema(src_Macd, slow_length_Macd)
macd_Macd = fast_ma_Macd - slow_ma_Macd
signal_Macd = ema(macd_Macd, signal_length_Macd)
hist_Macd = macd_Macd - signal_Macd
//cross Macd
MacdUp = crossover(macd_Macd,signal_Macd) ? 1 : 0
MacdDown = crossunder (macd_Macd,signal_Macd) ? 1 : 0
plotshape(MacdUp, text="+Md", title="(+)MACD UP", location=location.belowbar, color=color.green, transp=30, style=shape.triangleup, size=size.tiny, show_last=return)
plotshape(MacdDown, text="-Md", title="(-)MACD DN", location=location.abovebar, color=color.red, transp=30, style=shape.triangledown, size=size.tiny, show_last=return)
//
//*****************************************************************************************
//Function==> Função | (11) tsi() - Trading Strenght Indicator ==> Indice de Força do Trading
//Reference: Pine Script Manual - adapted TradingView version - Dalmar Santos
//*****************************************************************************************
_Tsi	= input(title = "═════ Tsi ══════════", type = input.bool, defval = false)
long_tsi = input(title="Long Length", type=input.integer, defval=72)
short_tsi = input(title="Short Length", type=input.integer, defval=17)
signal_tsi = input(title="Signal Length", type=input.integer, defval=17)
price_tsi = close
double_smooth(src_tsi, long_tsi, short_tsi) =>
	fist_smooth_tsi = ema(src_tsi, long_tsi)
	ema(fist_smooth_tsi, short_tsi)
pc_tsi = change(price_tsi)
double_smoothed_pc_tsi = double_smooth(pc_tsi, long_tsi, short_tsi)
double_smoothed_abs_pc_tsi = double_smooth(abs(pc_tsi), long_tsi, short_tsi)
tsi_value_tsi = 100 * (double_smoothed_pc_tsi / double_smoothed_abs_pc_tsi)
//TSI signal ==> Signal do TSI
TsiUp = crossover(tsi_value_tsi,ema(tsi_value_tsi, signal_tsi)) ? 1 : 0
TsiDown = crossunder(tsi_value_tsi,ema(tsi_value_tsi, signal_tsi)) ? 1 : 0
//Show the Position ==> Mostra a posicao
plotshape(TsiUp==1 ? low : na, text="+Tsi", title="(+)TSI Up", location=location.belowbar, color=color.green, transp=30, style=shape.triangleup, size=size.tiny, show_last=return)
plotshape(TsiDown==1 ? high : na, text="-Tsi", title="(-)TSI DN", location=location.abovebar, color=color.red, transp=30, style=shape.triangledown, size=size.tiny, show_last=return)
//
//***************************************************************************
//Function==> Função | (12) Buy and Sell TRADE Points
//Reference: Pine Script Manual - adapted TradingView version - Dalmar Santos
//***************************************************************************
//Cross Point ==> pontos de cruzamento
crossUP=crossover(emaOhlc4,dema34)
crossDN=crossunder(emaOhlc4,dema34)
//Show de Buy and Sell points ==> mostra pontos de compra e venda
tradeColor=crossUP ? color.red : crossDN ? color.green : na
//line buy or sell ==> linha de compra ou venda
plot(crossUP ? dema34 : crossDN ? dema34: na, color=tradeColor, style=plot.style_line, linewidth=4, editable=false, show_last=return)
//Buy point ==> pontos de compra
plotshape(crossUP ? dema34 : na, style=shape.labelup, location=location.absolute, text="Buy", transp=0, textcolor = color.white, color=color.green, editable=false, show_last=return)
//Sell points ==> pontos de venda
plotshape(crossDN ? dema34: na, style=shape.labeldown, location=location.absolute, text="Sell", transp=0, textcolor = color.white, color=color.red, editable=false, show_last=return)
//
//************************************************************
//Function==> Função | (13) Strategy Buy and Sell TRADE Points
//Reference: Pine Script Manual - Dalmar Santos
//************************************************************
//Start backtest year, month, day, hour, minute, second ==> Inicio do backtest ano, mês, dia, hora, minuto, segundo
start = timestamp(2021,01,01,1,00,00)
//*****************
//BUY ==> COMPRA
//*****************
if time>= start
    if crossUP
        strategy.close("Short", comment="Close Sell")
        strategy.entry("Long", strategy.long, 1, comment="Open Buy")

//*****************
//SELL ==> Venda
//*****************
    if crossDN
        strategy.close("Long", comment="Close Buy")
        strategy.entry("Short", strategy.short, 1, comment="Open Sell")