RSI V প্যাটার্নের উপর ভিত্তি করে স্বল্পমেয়াদী লাভের কৌশল
ওভারভিউ
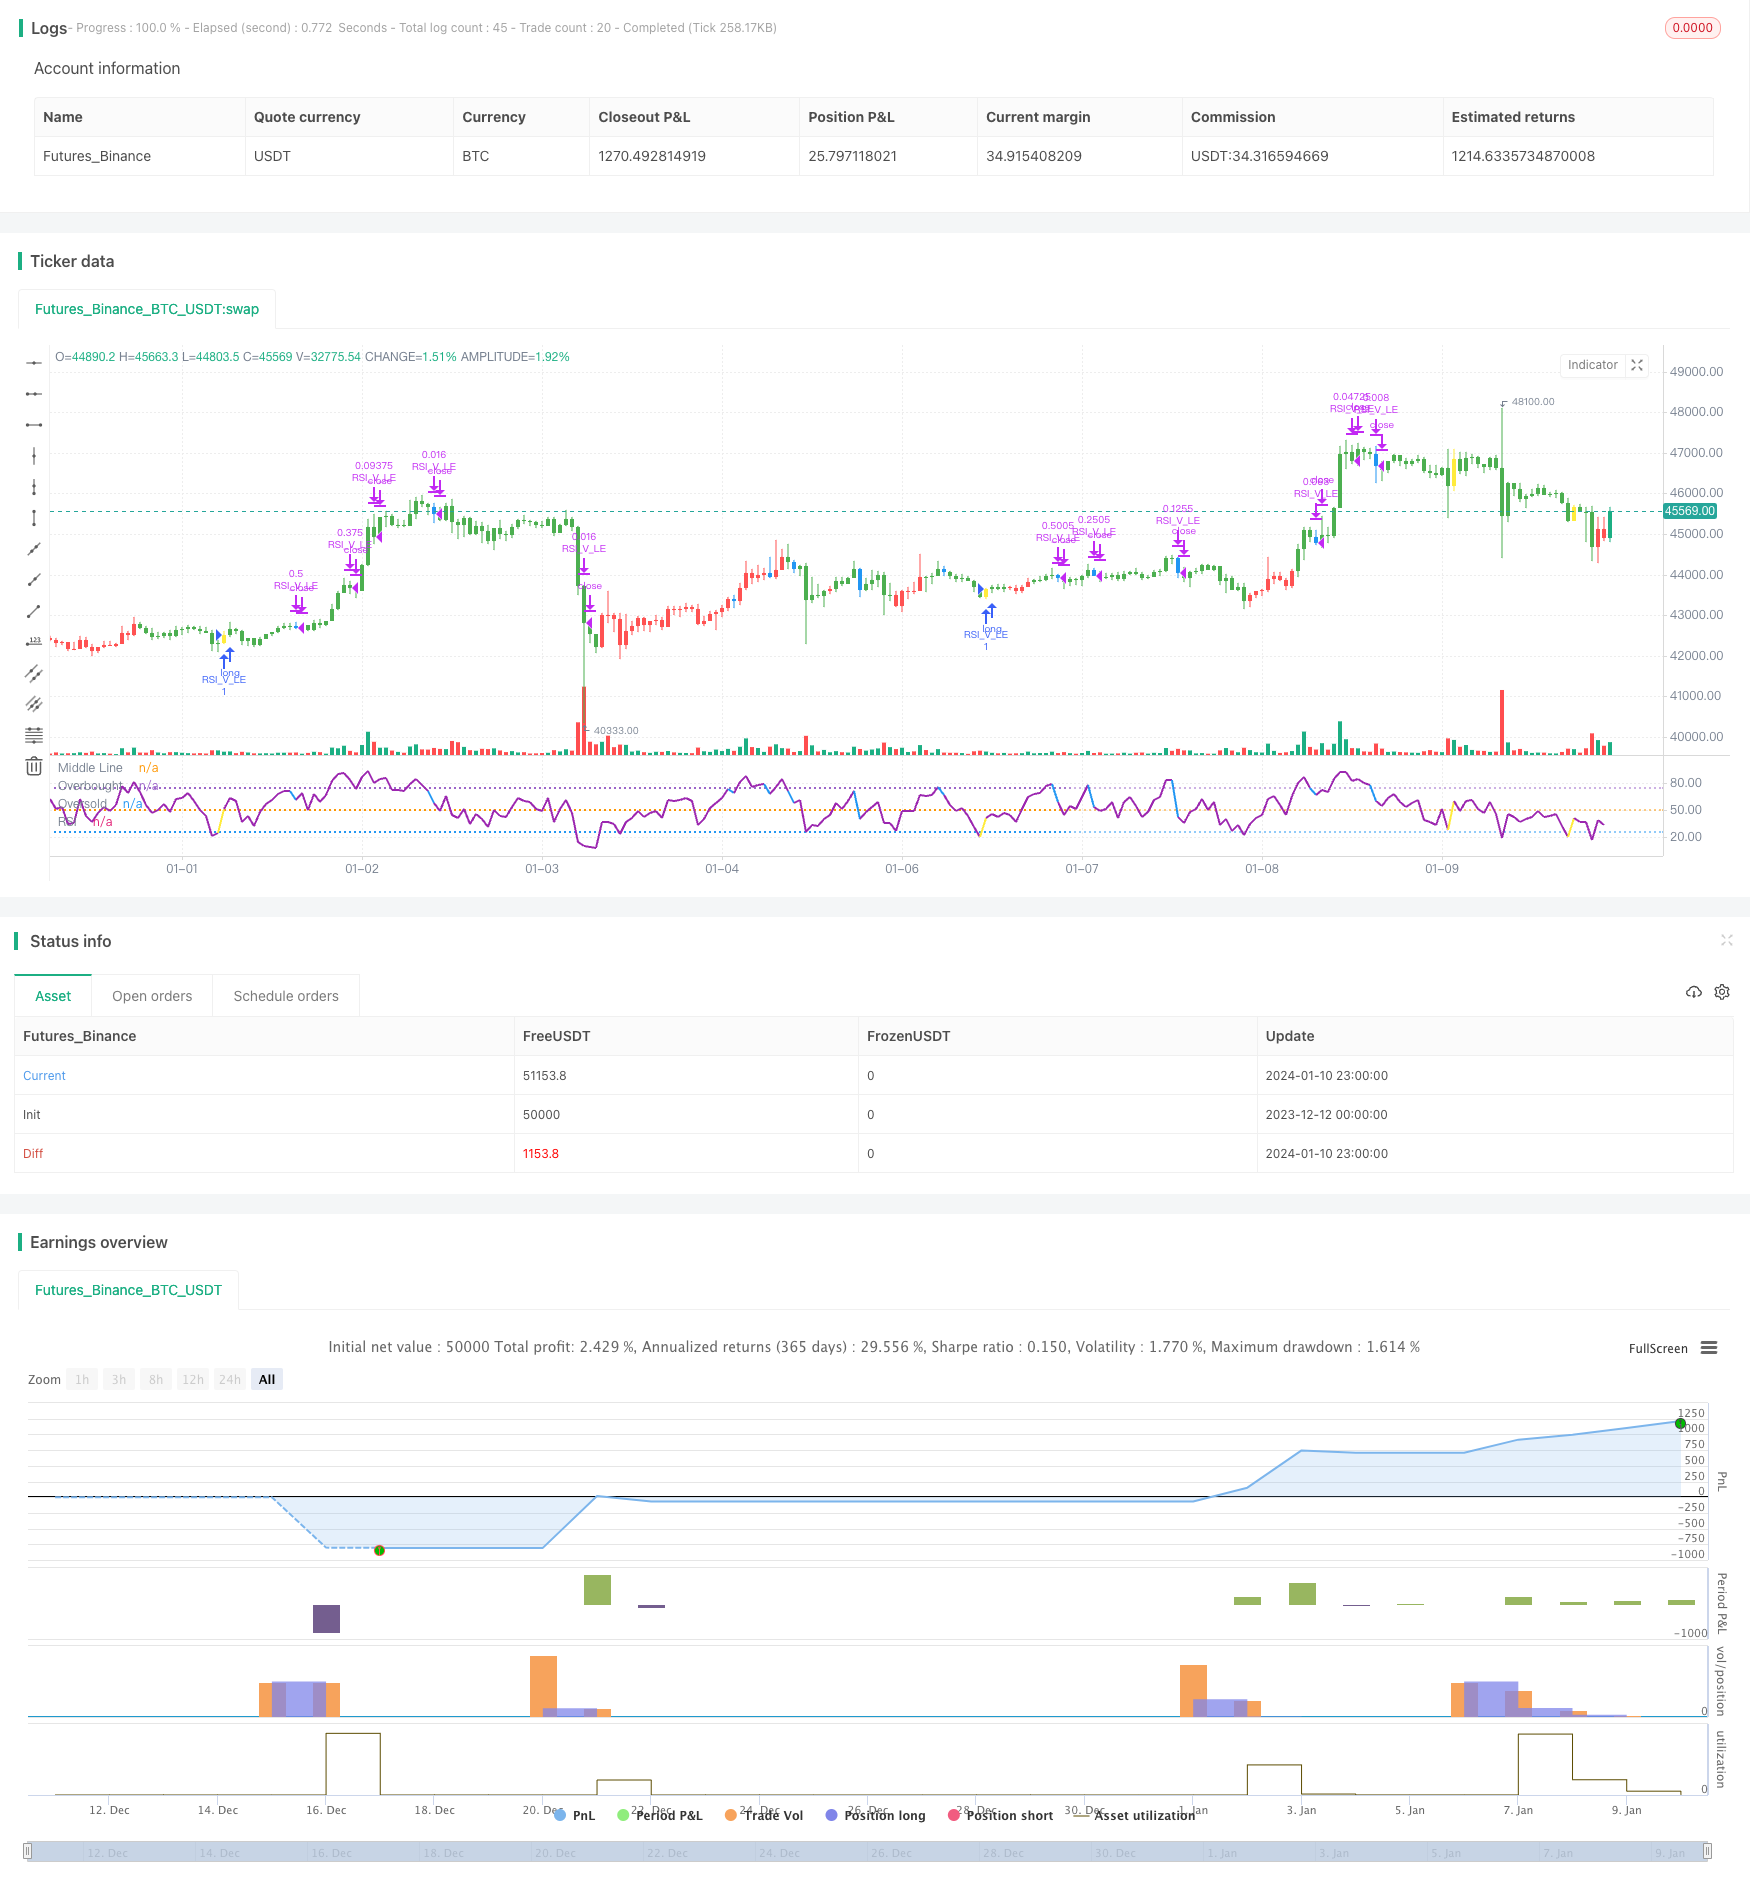
এই কৌশলটি RSI এর V- আকৃতির উপর ভিত্তি করে তৈরি করা হয়েছে, যা EMA গড়-লাইন ফিল্টারিংয়ের সাথে কাজ করে, যা একটি নির্ভরযোগ্য সংক্ষিপ্ত-লাইন মুনাফা কৌশল তৈরি করে। এটি ওভারসোল্ড অঞ্চলে দামের বিপর্যয় সৃষ্টির সুযোগকে ধরতে পারে, আরএসআই এর V- আকৃতির সংকেত দ্বারা আরও বেশি করে, সংক্ষিপ্ত লাইনে মুনাফা অর্জনের উদ্দেশ্যে।
কৌশল নীতি
- ২০ তারিখের লাইনটি ৫০ তারিখের লাইনের উপরে লম্বা লাইন হিসেবে ব্যবহার করে
- RSI V- আকৃতির, ওভারসোল্ড রিবাউন্ডের সুযোগকে নির্দেশ করে
- পূর্ববর্তী K-রেখার সর্বনিম্নটি পূর্ববর্তী দুটি K-রেখার সর্বনিম্নের চেয়ে কম
- বর্তমান K-লাইন RSI পূর্ববর্তী দুটি K-লাইন RSI এর চেয়ে বেশি
- RSI উপর 30 একটি V- আকৃতির সমাপ্তি সংকেত হিসাবে, আরো করতে
- স্টপ লস ৮% এর নিচে
- আরএসআই ৭০ অতিক্রম করে, স্টপ লস প্রবেশ মূল্যের দিকে চলে যায়
- আরএসআই 90 এর মধ্য দিয়ে শুরু হয় 3⁄4 ইঞ্চি
- আরএসআই 10 / স্টপ লস ট্রিগার অতিক্রম করেছে, সমস্ত পজিশন খালি
সামর্থ্য বিশ্লেষণ
- EMA গড় ব্যবহার করে বড় প্রবণতা দিক নির্ণয় করুন, বিপরীত অপারেশন এড়িয়ে চলুন
- আরএসআই ভি আকৃতি ওভারসোল্ড অঞ্চলে রিবাউন্ডের সুযোগের বিচার করে, বিপরীত প্রবণতা ক্যাপচার করে
- মাল্টিপল স্টপ মেশিনের ঝুঁকি নিয়ন্ত্রণ
ঝুঁকি বিশ্লেষণ
- চীনের শেয়ারবাজারের পতন ক্ষতির কারণ হতে পারে
- আরএসআই ভি আকৃতির সংকেত ত্রুটিযুক্ত হতে পারে, যা অপ্রয়োজনীয় ক্ষতির কারণ হতে পারে
অপ্টিমাইজেশান দিক
- আরএসআই প্যারামিটারগুলিকে আরও নির্ভরযোগ্য আরএসআই ভি ফর্ম্যাটগুলির সন্ধান করতে অনুকূলিত করুন
- অন্যান্য সূচকের সাথে মিলিতভাবে বিপরীত সিগন্যালের নির্ভরযোগ্যতা নির্ণয় করা
- অপ্টিমাইজ করা স্টপ লস কৌশল, সময়মত স্টপ লস এড়ানো এবং অত্যধিক র্যাডিক্যাল হওয়া এড়ানো
সারসংক্ষেপ
এই কৌশলটি ইএমএ সমান্তরাল ফিল্টার এবং আরএসআই ভি মোডের বিচারকে একত্রিত করে একটি নির্ভরযোগ্য সংক্ষিপ্ত লাইন অপারেশন কৌশল তৈরি করে। এটি ওভারসোল্ড অঞ্চলের রিবাউন্ডের সুযোগকে কার্যকরভাবে দখল করতে পারে এবং সংক্ষিপ্ত লাইনে মুনাফা অর্জন করতে পারে। প্যারামিটার এবং মডেলগুলিকে ক্রমাগত অনুকূলিতকরণ এবং ক্ষতির ব্যবস্থাকে উন্নত করার মাধ্যমে এই কৌশলটি স্থিতিশীলতা এবং লাভজনকতাকে আরও বাড়িয়ে তুলতে পারে। এটি পরিমাণযুক্ত ব্যবসায়ীদের জন্য অন্য সংক্ষিপ্ত লাইন মুনাফার দরজা খুলে দেয়।
/*backtest
start: 2023-12-12 00:00:00
end: 2024-01-11 00:00:00
period: 1h
basePeriod: 15m
exchanges: [{"eid":"Futures_Binance","currency":"BTC_USDT"}]
*/

// This source code is subject to the terms of the Mozilla Public License 2.0 at https://mozilla.org/MPL/2.0/
// © mohanee

//@version=4
//strategy("RSI V Pattern", overlay=true)
strategy(title="RSI V Pattern", overlay=false )

//Strategy Rules
//ema20 is above ema50  --- candles are colored  green on the chart
//RSI value sharply coming up which makes a V shape ,  colored in yellow on the chart
//RSI V pattern should occur from below 30

len = input(title="RSI Period", minval=1, defval=5)
stopLoss = input(title="Stop Loss %", minval=1, defval=8)

myRsi = rsi(close,len)

longEmaVal=ema(close,50)
shortEmaVal=ema(close,20)

//plot emas
//plot(longEmaVal, title="Long EMA" ,linewidth=2, color=color.orange, trackprice=true)
//plot(shortEmaVal, title="Short EMA" ,linewidth=2, color=color.green, trackprice=true)


longCondition =  ema(close,20)>ema(close,50)   and (low[1]<low[2] and  low[1]<low[3]) and (myRsi>myRsi[1] and myRsi>myRsi[2] ) and crossover(myRsi,30) //  (   and myRsi<60)

//(myRsi<60 and myRsi>30)  and myRsi>myRsi[1] and (myRsi[1]<myRsi[2]  or  myRsi[1]<myRsi[3]) and (myRsi[2]<30)  and (myRsi[3]<30 and myRsi[4]>=30)


barcolor(shortEmaVal>longEmaVal?color.green:color.red)
//longCondition = crossover(sma(close, 14), sma(close, 28))
barcolor(longCondition?color.yellow:na)
strategy.entry("RSI_V_LE", strategy.long, when=longCondition )
//stoploss value at 10%
stopLossValue=strategy.position_avg_price -  (strategy.position_avg_price*stopLoss/100)
//stopLossValue=valuewhen(longCondition,low,3)


//takeprofit at RSI highest  reading
//at RSI75 move the stopLoss to entry price
moveStopLossUp=strategy.position_size>0 and crossunder(myRsi,70)
barcolor(moveStopLossUp?color.blue:na)
stopLossValue:=crossover(myRsi,70) ? strategy.position_avg_price:stopLossValue

//stopLossValue:=moveStopLossUp?strategy.position_avg_price:stopLossValue
rsiPlotColor=longCondition ?color.yellow:color.purple
rsiPlotColor:= moveStopLossUp ?color.blue:rsiPlotColor
plot(myRsi, title="RSI", linewidth=2, color=rsiPlotColor)
//longCondition?color.yellow:#8D1699)
hline(50, title="Middle Line", linestyle=hline.style_dotted)
obLevel = hline(75, title="Overbought", linestyle=hline.style_dotted)
osLevel = hline(25, title="Oversold", linestyle=hline.style_dotted)
fill(obLevel, osLevel, title="Background", color=#9915FF, transp=90)


//when RSI crossing down 70 , close 1/2 position and move stop loss to average entry price
strategy.close("RSI_V_LE",  qty=strategy.position_size*1/2, when=strategy.position_size>0 and crossunder(myRsi,70))

//when RSI reaches high reading 90 and crossing down close 3/4 position
strategy.close("RSI_V_LE",  qty=strategy.position_size*3/4, when=strategy.position_size>0 and crossunder(myRsi,90))


//close everything when Rsi goes down below to 10 or stoploss hit
//just keeping RSI cross below 10 , can work as stop loss , which also keeps you long in the trade ... however sharp declines could  make large loss
//so I combine RSI goes below 10 OR stoploss hit  , whichever comes first - whole posiition closed
longCloseCondition=crossunder(myRsi,10)  or close<stopLossValue
strategy.close("RSI_V_LE", qty=strategy.position_size,when=longCloseCondition )